March 30 COVID-19 Update: Cumulative Cases Up One in Both Old Lyme (to 311) and Lyme (to 96)

Transmission electron microscopic image of an isolate from the first U.S. case of COVID-19. Photo courtesy of the CDC.

LYME/OLD LYME — The Daily Data Report for Connecticut issued Tuesday, March 30, by the Connecticut Department of Public Health (CT-DPH) for data as at 8:30 p.m., Monday, March 29, shows that cumulative cases (confirmed and probable) since the pandemic began INCREASED BY ONE in both Old Lyme (to 311) and Lyme (to 96) when compared with the numbers reported Monday, March 29.

Old Lyme – Cumulative Cases Up One

Tuesday’s report shows that Old Lyme has a cumulative total (since the outbreak began) of 304 confirmed COVID-19 cases and SEVEN probable casesmaking a TOTAL of 311 cases.

This represents an INCREASE of ONE in the cumulative number of confirmed cases compared with those reported Monday, March 29, and NO CHANGE in the number of probable cases.

The total number of Old Lyme residents tested is 4,935, an increase of eight over Friday’s number of 4,927.

Lyme – Cumulative Cases Up One

Lyme has a cumulative total (since the outbreak began) of 88 confirmed cases and EIGHT probable cases, making a TOTAL of 96 cases.

This represents an INCREASE of ONE in the cumulative number of confirmed cases and NO CHANGE in the number of probable cases compared with those reported Monday, March 29.

The total number of Lyme residents tested is 1,328, an increase of four compared with Monday’s number of 1,324.

Two-Week Case Rates: Old Lyme Back in Red (highest) Zone, Lyme Stays in Gray (lowest) Zone

The report issued Tuesday, March 30, by the Connecticut Department of Public Health (CT DPH) for the average daily rate of new cases of COVID-19 by town during the past two weeks contains worrying news for the whole state including Old Lyme. Lyme, however, continues to maintain the low infection rate reported last week.

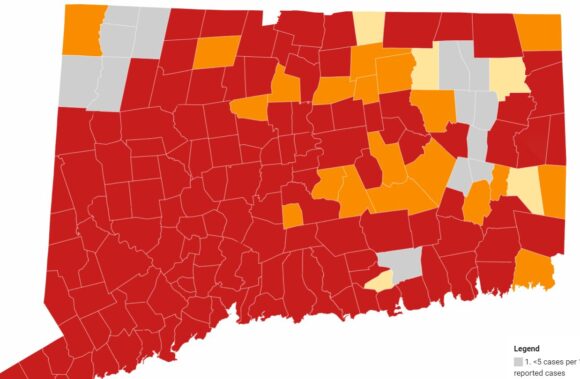
The report shows that Old Lyme has moved back into the Red (highest) Zone for two-week new case rates, but Lyme has retained its position in the Gray (lowest) Zone.

Last week, Old Lyme was in the (second highest) Orange Zone and so this change reflects a further increase in the two-week case rate over the previous week. In contrast, Lyme has recorded a second straight week in the lowest zone. (Four zones are specified by the CT DPH — see details below)

Overall, the report contains disappointing news for the whole state with the number of towns in the Gray, Yellow and Orange Zones all decreasing this week (the previous week’s figures are shown in parentheses), reflecting a statewide  increase in infection rates:

  • 13 (22) towns are now in the (lowest case rate) Gray Zone
  • 5 (9) are in the (lowest but one) Yellow Zone
  • 20 (33) are in the (second highest case rate) Orange Zone.

All the remaining 131 towns are in the Red Zone, and the state as a whole is moving once again towards the map we published in November when every town in the state was in the Red Zone. The numbers are concerning in that the trend appears to be that cases are continuing to increase at this point.

Lyme joins only 12 other towns in the Gray (lowest rate) Zone: Ashford, Chaplin, Cornwall, Eastford, Franklin, Hampton, New Canaan, North Stonington, Norfolk, Sharon, Scotland and Sprague.

The Yellow (second lowest rate) Zone now has only five towns: Essex, Griswold, Pomfret, Somers and Willington.

  • The gray category is defined as when the Average Daily Rate of COVID-19 Cases Among Persons Living in Community Settings per 100,000 Population By Town is less than five or less than five reported cases.
  • The yellow category is defined as when the Average Daily Rate of COVID-19 Cases Among Persons Living in Community Settings per 100,000 Population By Town is between five and nine reported cases.
  • The orange category is defined as when the Average Daily Rate of COVID-19 Cases Among Persons Living in Community Settings per 100,000 Population By Town is between 10 and 14.
  • The red category is defined as when the Average Daily Rate of COVID-19 Cases Among Persons Living in Community Settings per 100,000 Population By Town exceeds 15.

In all cases, this rate does not include cases or tests among residents of nursing home, assisted living, or correctional facilities.

This report is issued daily, but only updated weekly on Thursdays. The most recent report was updated Thursday, March 25; the next updated report will be issued in the afternoon of Thursday, April 1.

More Detail on Two-Week Case Rates

LLHD Director of Health Stephen Mansfield

On Thursday, March 25, Ledge Light Health District (LLHD) also issued their latest weekly report of COVID data for the municipalities within their District. Ledge Light Director of Health Stephen Mansfield prefaces the report with the comment, “We continue to see relatively steady case numbers within our jurisdiction. Our contact tracers report clusters associated with daycares, schools, and workplaces, and transmissions linked to social gatherings and sporting events.”

He stresses, however, “Although we are making great strides with our COVID vaccination program, it is still imperative that we remain diligent in our mitigation strategies.”

The latest two-week case rates announced Thursday, March 25, for the period 3/07 to 3/20 per 100,000 population (compared with the previous two-week case rate for 2/28 to 3/13) have again increased in Old Lyme and remained constant in Lyme.

The two-week case rates are as follows:

  • Old Lyme from 13.6 to 15.5
  • Lyme from 9.2 to 9.2

The same report shows that the case numbers in Week 1 and Week 2 respectively and recorded for the period 3/07 to 3/20  (compared with the previous two-week case rate for 2/28 to 3/13 shown in parentheses) are as follows:

  • Lyme had(3) cases in Week 1 and(0) in Week 2
  • Old Lyme had 9 (5) cases in Week 1 and (9) in Week 2

This data was updated March 25, 2021. The next Ledge Light Weekly Data Report for its District will be issued in the afternoon of Thursday, April 1.

Vaccination Rates

At the request of several readers, we have started a new section reflecting the status of community vaccination rates in Lyme and Old Lyme. The data is taken from the COVID-19 Vaccinations by Town report published by CT-DPH, which is published roughly weekly.

Lyme is now ahead of Old Lyme in terms of the percentage of its total population that have received a first dose, with 49.01 percent vaccinated compared with 44.36 percent in Old Lyme. The percentages for both towns for the age segments 65-74 and 75+ are very encouraging with Lyme now having 101.82 percent of seniors 75 and above having received their first dose and 94.84 percent of the same age segment having received it in Old Lyme. Editor’s Note: We are skeptical of these figures for Old Lyme since they show the numbers vaccinated in the two age segments decreasing compared with last week. We are investigating further.

The detailed data below is the most recent and was updated March 245.

Old Lyme
Total population:  7,306
Estimated population age 65-74:  1,067
Estimated population age 75 and above:  794

[table id=12 /]

Lyme
Total population:  2,316
Estimated population age 65-74:  372
Estimated population age 75 and above:  274

[table id=11 /]

Three Fatalities in Old Lyme Since Pandemic Began, None in Lyme

According to the report mentioned above, there have now been THREE fatalities in Old Lyme. Asked Tuesday, Feb. 9, for details of this third fatality, Ledge Light Health Department Director of Health Stephen Mansfield responded, “We have not been notified of any recent deaths in Old Lyme. Keep in mind that that report is compiled by the Connecticut Department of Public Health; deaths are not reportable to local health districts.”

He added, “I can’t speak for their data sources.”

The two fatalities from Old Lyme previously reported in 2020 were a 61-year-old female and an 82-year-old male.

No fatalities have been reported in Lyme.

Connecticut Hospital Occupancy

At the request of several readers, we are adding a new report today showing the respective rates of hospital occupancy at local hospitals. The data for this report is obtained from the Connecticut Hospital Occupancy Report published weekly by the CT DPH and extracted from the United States Department of Health and Human Services (HHS) facility-level data for hospital utilization aggregated on a weekly basis (Friday to Thursday).

[table id=10 /]

Editor’s Note: The state issues a COVID-19 metric report daily around 4 p.m. Monday through Friday, which includes current data up to the previous evening. In light of the ongoing rise in Coronavirus cases, we publish a new weekday update reporting confirmed and probable COVID-19 cases in Lyme and Old Lyme. 

March 29 COVID-19 Update: Cumulative Cases Up Two in Old Lyme to 310, Lyme Holds at 95

LYME/OLD LYME — The Daily Data Report for Connecticut issued Monday, March 29, by the Connecticut Department of Public Health (CT-DPH) for data as at 8:30 p.m., Sunday, March 28, shows that cumulative cases (confirmed and probable) since the pandemic began INCREASED BY TWO in Old Lyme to 310 but were UNCHANGED in Lyme for the third reporting day in a row at 95 when compared with the numbers reported Friday, March 26.

Old Lyme – Cumulative Cases Up Two

Monday’s report shows that Old Lyme has a cumulative total (since the outbreak began) of 303 confirmed COVID-19 cases and SEVEN probable casesmaking a TOTAL of 310 cases.

This represents an INCREASE of TWO in the cumulative number of confirmed cases compared with those reported Friday, March 26, and NO CHANGE in the number of probable cases.

The total number of Old Lyme residents tested is 4,927, an increase of 22 over Friday’s number of 4,905.

Lyme – No Change in Cumulative Cases

Lyme has a cumulative total (since the outbreak began) of 87 confirmed cases and EIGHT probable cases, making a TOTAL of 95 cases.

This represents NO CHANGE in the cumulative number of confirmed or probable cases compared with those reported Friday, March 26.

The total number of Lyme residents tested is 1,324, a decrease of one compared with Friday’s number of 1,325.

Two-Week Case Rates: Old Lyme Back in Red (highest) Zone, Lyme Stays in Gray (lowest) Zone

The report issued Monday, March 29, by the Connecticut Department of Public Health (CT DPH) for the average daily rate of new cases of COVID-19 by town during the past two weeks contains worrying news for the whole state including Old Lyme. Lyme, however, continues to maintain the low infection rate reported last week.

The report shows that Old Lyme has moved back into the Red (highest) Zone for two-week new case rates, but Lyme has retained its position in the Gray (lowest) Zone.

Last week, Old Lyme was in the (second highest) Orange Zone and so this change reflects a further increase in the two-week case rate over the previous week. In contrast, Lyme has recorded a second straight week in the lowest zone. (Four zones are specified by the CT DPH — see details below)

Overall, the report contains disappointing news for the whole state with the number of towns in the Gray, Yellow and Orange Zones all decreasing this week (the previous week’s figures are shown in parentheses), reflecting a statewide  increase in infection rates:

  • 13 (22) towns are now in the (lowest case rate) Gray Zone
  • 5 (9) are in the (lowest but one) Yellow Zone
  • 20 (33) are in the (second highest case rate) Orange Zone.

All the remaining 131 towns are in the Red Zone, and the state as a whole is moving once again towards the map we published in November when every town in the state was in the Red Zone. The numbers are concerning in that the trend appears to be that cases are continuing to increase at this point.

Lyme joins only 12 other towns in the Gray (lowest rate) Zone: Ashford, Chaplin, Cornwall, Eastford, Franklin, Hampton, New Canaan, North Stonington, Norfolk, Sharon, Scotland and Sprague.

The Yellow (second lowest rate) Zone now has only five towns: Essex, Griswold, Pomfret, Somers and Willington.

  • The gray category is defined as when the Average Daily Rate of COVID-19 Cases Among Persons Living in Community Settings per 100,000 Population By Town is less than five or less than five reported cases.
  • The yellow category is defined as when the Average Daily Rate of COVID-19 Cases Among Persons Living in Community Settings per 100,000 Population By Town is between five and nine reported cases.
  • The orange category is defined as when the Average Daily Rate of COVID-19 Cases Among Persons Living in Community Settings per 100,000 Population By Town is between 10 and 14.
  • The red category is defined as when the Average Daily Rate of COVID-19 Cases Among Persons Living in Community Settings per 100,000 Population By Town exceeds 15.

In all cases, this rate does not include cases or tests among residents of nursing home, assisted living, or correctional facilities.

This report is issued daily, but only updated weekly on Thursdays. The most recent report was updated Thursday, March 25; the next updated report will be issued in the afternoon of Thursday, April 1.

More Detail on Two-Week Case Rates

LLHD Director of Health Stephen Mansfield

On Thursday, March 25, Ledge Light Health District (LLHD) also issued their latest weekly report of COVID data for the municipalities within their District. Ledge Light Director of Health Stephen Mansfield prefaces the report with the comment, “We continue to see relatively steady case numbers within our jurisdiction. Our contact tracers report clusters associated with daycares, schools, and workplaces, and transmissions linked to social gatherings and sporting events.”

He stresses, however, “Although we are making great strides with our COVID vaccination program, it is still imperative that we remain diligent in our mitigation strategies.”

The latest two-week case rates announced Thursday, March 25, for the period 3/07 to 3/20 per 100,000 population (compared with the previous two-week case rate for 2/28 to 3/13) have again increased in Old Lyme and remained constant in Lyme.

The two-week case rates are as follows:

  • Old Lyme from 13.6 to 15.5
  • Lyme from 9.2 to 9.2

The same report shows that the case numbers in Week 1 and Week 2 respectively and recorded for the period 3/07 to 3/20  (compared with the previous two-week case rate for 2/28 to 3/13 shown in parentheses) are as follows:

  • Lyme had(3) cases in Week 1 and(0) in Week 2
  • Old Lyme had 9 (5) cases in Week 1 and (9) in Week 2

This data was updated March 25, 2021. The next Ledge Light Weekly Data Report for its District will be issued in the afternoon of Thursday, April 1.

Vaccination Rates

At the request of several readers, we have started a new section reflecting the status of community vaccination rates in Lyme and Old Lyme. The data is taken from the COVID-19 Vaccinations by Town report published by CT-DPH, which is published roughly weekly.

Lyme is now ahead of Old Lyme in terms of the percentage of its total population that have received a first dose, with 49.01 percent vaccinated compared with 44.36 percent in Old Lyme. The percentages for both towns for the age segments 65-74 and 75+ are very encouraging with Lyme now having 101.82 percent of seniors 75 and above having received their first dose and 94.84 percent of the same age segment having received it in Old Lyme. Editor’s Note: We are skeptical of these figures for Old Lyme since they show the numbers vaccinated in the two age segments decreasing compared with last week. We are investigating further.

The detailed data below is the most recent and was updated March 245.

Old Lyme
Total population:  7,306
Estimated population age 65-74:  1,067
Estimated population age 75 and above:  794

[table id=12 /]

Lyme
Total population:  2,316
Estimated population age 65-74:  372
Estimated population age 75 and above:  274

[table id=11 /]

Three Fatalities in Old Lyme Since Pandemic Began, None in Lyme

According to the report mentioned above, there have now been THREE fatalities in Old Lyme. Asked Tuesday, Feb. 9, for details of this third fatality, Ledge Light Health Department Director of Health Stephen Mansfield responded, “We have not been notified of any recent deaths in Old Lyme. Keep in mind that that report is compiled by the Connecticut Department of Public Health; deaths are not reportable to local health districts.”

He added, “I can’t speak for their data sources.”

The two fatalities from Old Lyme previously reported in 2020 were a 61-year-old female and an 82-year-old male.

No fatalities have been reported in Lyme.

Connecticut Hospital Occupancy

At the request of several readers, we are adding a new report today showing the respective rates of hospital occupancy at local hospitals. The data for this report is obtained from the Connecticut Hospital Occupancy Report published weekly by the CT DPH and extracted from the United States Department of Health and Human Services (HHS) facility-level data for hospital utilization aggregated on a weekly basis (Friday to Thursday).

[table id=10 /]

Editor’s Note: The state issues a COVID-19 metric report daily around 4 p.m. Monday through Friday, which includes current data up to the previous evening. In light of the ongoing rise in Coronavirus cases, we publish a new weekday update reporting confirmed and probable COVID-19 cases in Lyme and Old Lyme. 

March 26 COVID-19 Update: Cumulative Cases Up Four in Old Lyme to 308, Lyme Holds at 95

Photo by CDC on Unsplash

LYME/OLD LYME — The Daily Data Report for Connecticut issued Friday, March 26, by the Connecticut Department of Public Health (CT-DPH) for data as at 8:30 p.m., Thursday, March 25, shows that cumulative cases (confirmed and probable) since the pandemic began INCREASED BY FOUR in Old Lyme to 308 but were UNCHANGED in Lyme at 95 when compared with the numbers reported Thursday, March 25.

Old Lyme – Cumulative Cases Up Four

Friday’s report shows that Old Lyme has a cumulative total (since the outbreak began) of 301 confirmed COVID-19 cases and SEVEN probable casesmaking a TOTAL of 308 cases.

This represents an INCREASE of FOUR in the cumulative number of confirmed cases compared with those reported Thursday, March 25, and NO CHANGE in the number of probable cases.

The total number of Old Lyme residents tested is 4,905, an increase of eight over Thursday’s number of 4,897.

Lyme – No Change in Cumulative Cases 

Lyme has a cumulative total (since the outbreak began) of 87 confirmed cases and EIGHT probable cases, making a TOTAL of 95 cases.

This represents NO CHANGE in the cumulative number of confirmed or probable cases compared with those reported Thursday, March 25.

The total number of Lyme residents tested is 1,325, an increase of five over Thursday’s number of 1,320.

Two-Week Case Rates: Old Lyme Back in Red (highest) Zone, Lyme Stays in Gray (lowest) Zone

The report issued Thursday, March 25, by the Connecticut Department of Public Health (CT DPH) for the average daily rate of new cases of COVID-19 by town during the past two weeks contains worrying news for the whole state including Old Lyme. Lyme, however, continues to maintain the low infection rate reported last week.

The report shows that Old Lyme has moved back into the Red (highest) Zone for two-week new case rates, but Lyme has retained its position in the Gray (lowest) Zone.

Last week, Old Lyme was in the (second highest) Orange Zone and so this change reflects a further increase in the two-week case rate over the previous week. In contrast, Lyme has recorded a second straight week in the lowest zone. (Four zones are specified by the CT DPH — see details below)

Overall, the report contains disappointing news for the whole state with the number of towns in the Gray, Yellow and Orange Zones all decreasing this week (the previous week’s figures are shown in parentheses), reflecting a statewide  increase in infection rates:

  • 13 (22) towns are now in the (lowest case rate) Gray Zone
  • 5 (9) are in the (lowest but one) Yellow Zone
  • 20 (33) are in the (second highest case rate) Orange Zone.

All the remaining 131 towns are in the Red Zone, and the state as a whole is moving once again towards the map we published in November when every town in the state was in the Red Zone. The numbers are concerning in that the trend appears to be that cases are continuing to increase at this point.

Lyme joins only 12 other towns in the Gray (lowest rate) Zone: Ashford, Chaplin, Cornwall, Eastford, Franklin, Hampton, New Canaan, North Stonington, Norfolk, Sharon, Scotland and Sprague.

The Yellow (second lowest rate) Zone now has only five towns: Essex, Griswold, Pomfret, Somers and Willington.

  • The gray category is defined as when the Average Daily Rate of COVID-19 Cases Among Persons Living in Community Settings per 100,000 Population By Town is less than five or less than five reported cases.
  • The yellow category is defined as when the Average Daily Rate of COVID-19 Cases Among Persons Living in Community Settings per 100,000 Population By Town is between five and nine reported cases.
  • The orange category is defined as when the Average Daily Rate of COVID-19 Cases Among Persons Living in Community Settings per 100,000 Population By Town is between 10 and 14.
  • The red category is defined as when the Average Daily Rate of COVID-19 Cases Among Persons Living in Community Settings per 100,000 Population By Town exceeds 15.

In all cases, this rate does not include cases or tests among residents of nursing home, assisted living, or correctional facilities.

This report is issued daily, but only updated weekly on Thursdays. The most recent report was updated Thursday, March 25; the next updated report will be issued in the afternoon of Thursday, April 1.

More Detail on Two-Week Case Rates

LLHD Director of Health Stephen Mansfield

On Thursday, March 25, Ledge Light Health District (LLHD) also issued their latest weekly report of COVID data for the municipalities within their District. Ledge Light Director of Health Stephen Mansfield prefaces the report with the comment, “We continue to see relatively steady case numbers within our jurisdiction. Our contact tracers report clusters associated with daycares, schools, and workplaces, and transmissions linked to social gatherings and sporting events.”

He stresses, however, “Although we are making great strides with our COVID vaccination program, it is still imperative that we remain diligent in our mitigation strategies.”

The latest two-week case rates announced Thursday, March 25, for the period 3/07 to 3/20 per 100,000 population (compared with the previous two-week case rate for 2/28 to 3/13) have again increased in Old Lyme and remained constant in Lyme.

The two-week case rates are as follows:

  • Old Lyme from 13.6 to 15.5
  • Lyme from 9.2 to 9.2

The same report shows that the case numbers in Week 1 and Week 2 respectively and recorded for the period 3/07 to 3/20  (compared with the previous two-week case rate for 2/28 to 3/13 shown in parentheses) are as follows:

  • Lyme had(3) cases in Week 1 and(0) in Week 2
  • Old Lyme had 9 (5) cases in Week 1 and (9) in Week 2

This data was updated March 25, 2021. The next Ledge Light Weekly Data Report for its District will be issued in the afternoon of Thursday, April 1.

Vaccination Rates

At the request of several readers, we have started a new section reflecting the status of community vaccination rates in Lyme and Old Lyme. The data is taken from the COVID-19 Vaccinations by Town report published by CT-DPH, which is published roughly weekly.

Lyme is now ahead of Old Lyme in terms of the percentage of its total population that have received a first dose, with 49.01 percent vaccinated compared with 44.36 percent in Old Lyme. The percentages for both towns for the age segments 65-74 and 75+ are very encouraging with Lyme now having 101.82 percent of seniors 75 and above having received their first dose and 94.84 percent of the same age segment having received it in Old Lyme. Editor’s Note: We are skeptical of these figures for Old Lyme since they show the numbers vaccinated in the two age segments decreasing compared with last week. We are investigating further.

The detailed data below is the most recent and was updated March 245.

Old Lyme
Total population:  7,306
Estimated population age 65-74:  1,067
Estimated population age 75 and above:  794

[table id=12 /]

Lyme
Total population:  2,316
Estimated population age 65-74:  372
Estimated population age 75 and above:  274

[table id=11 /]

Three Fatalities in Old Lyme Since Pandemic Began, None in Lyme

According to the report mentioned above, there have now been THREE fatalities in Old Lyme. Asked Tuesday, Feb. 9, for details of this third fatality, Ledge Light Health Department Director of Health Stephen Mansfield responded, “We have not been notified of any recent deaths in Old Lyme. Keep in mind that that report is compiled by the Connecticut Department of Public Health; deaths are not reportable to local health districts.”

He added, “I can’t speak for their data sources.”

The two fatalities from Old Lyme previously reported in 2020 were a 61-year-old female and an 82-year-old male.

No fatalities have been reported in Lyme.

Connecticut Hospital Occupancy

At the request of several readers, we are adding a new report today showing the respective rates of hospital occupancy at local hospitals. The data for this report is obtained from the Connecticut Hospital Occupancy Report published weekly by the CT DPH and extracted from the United States Department of Health and Human Services (HHS) facility-level data for hospital utilization aggregated on a weekly basis (Friday to Thursday).

[table id=10 /]

Editor’s Note: The state issues a COVID-19 metric report daily around 4 p.m. Monday through Friday, which includes current data up to the previous evening. In light of the ongoing rise in Coronavirus cases, we publish a new weekday update reporting confirmed and probable COVID-19 cases in Lyme and Old Lyme. 

March 25 COVID-19 Update: Mirroring Much of CT, Old Lyme Returns to Red (Highest); Zone for Two-Week Case Rate; Lyme Stays in Gray (Lowest) Zone; Both Towns Up One New Case, OL to 304, Lyme to 95

This map, updated March 25, shows the average daily rate of new cases of COVID-19 by town during the past two weeks. The Town of Old Lyme has moved up into the (highest) Red Zone, while Lyme remains in the (lowest) Gray Zone. (Only cases among persons living in community settings are included in this map; the map does not include cases among people who reside in nursing home, assisted living, or correctional facilities.)

LYME/OLD LYME — The report issued Thursday, March 25, by the Connecticut Department of Public Health (CT DPH) for the average daily rate of new cases of COVID-19 by town during the past two weeks contains worrying news for the whole state including Old Lyme. Lyme, however, continues to maintain the low infection rate reported last week.

The report shows that Old Lyme has moved back into the Red (highest) Zone for two-week new case rates, but Lyme has retained its position in the Gray (lowest) Zone.

Last week, Old Lyme was in the (second highest) Orange Zone and so this change reflects a further increase in the two-week case rate over the previous week. In contrast, Lyme has recorded a second straight week in the lowest zone. (Four zones are specified by the CT DPH — see details below)

Overall, the report contains disappointing news for the whole state with the number of towns in the Gray, Yellow and Orange Zones all decreasing this week (the previous week’s figures are shown in parentheses), reflecting a statewide  increase in infection rates:

  • 13 (22) towns are now in the (lowest case rate) Gray Zone
  • 5 (9) are in the (lowest but one) Yellow Zone
  • 20 (33) are in the (second highest case rate) Orange Zone.

All the remaining 131 towns are in the Red Zone, and the state as a whole is moving once again towards the map we published in November when every town in the state was in the Red Zone. The numbers are concerning in that the trend appears to be that cases are continuing to increase at this point.

Lyme joins only 12 other towns in the Gray (lowest rate) Zone: Ashford, Chaplin, Cornwall, Eastford, Franklin, Hampton, New Canaan, North Stonington, Norfolk, Sharon, Scotland and Sprague.

The Yellow (second lowest rate) Zone now has only five towns: Essex, Griswold, Pomfret, Somers and Willington.

  • The gray category is defined as when the Average Daily Rate of COVID-19 Cases Among Persons Living in Community Settings per 100,000 Population By Town is less than five or less than five reported cases.
  • The yellow category is defined as when the Average Daily Rate of COVID-19 Cases Among Persons Living in Community Settings per 100,000 Population By Town is between five and nine reported cases.
  • The orange category is defined as when the Average Daily Rate of COVID-19 Cases Among Persons Living in Community Settings per 100,000 Population By Town is between 10 and 14.
  • The red category is defined as when the Average Daily Rate of COVID-19 Cases Among Persons Living in Community Settings per 100,000 Population By Town exceeds 15.

In all cases, this rate does not include cases or tests among residents of nursing home, assisted living, or correctional facilities.

This report is issued daily, but only updated weekly on Thursdays. The most recent report was updated Thursday, March 25; the next updated report will be issued in the afternoon of Thursday, April 1.

More Detail on Two-Week Case Rates

LLHD Director of Health Stephen Mansfield

On Thursday, March 25, Ledge Light Health District (LLHD) also issued their latest weekly report of COVID data for the municipalities within their District. Ledge Light Director of Health Stephen Mansfield prefaces the report with the comment, “We continue to see relatively steady case numbers within our jurisdiction. Our contact tracers report clusters associated with daycares, schools, and workplaces, and transmissions linked to social gatherings and sporting events.”

He stresses, however, “Although we are making great strides with our COVID vaccination program, it is still imperative that we remain diligent in our mitigation strategies.”

The latest two-week case rates announced Thursday, March 25, for the period 3/07 to 3/20 per 100,000 population (compared with the previous two-week case rate for 2/28 to 3/13) have again increased in Old Lyme and remained constant in Lyme.

The two-week case rates are as follows:

  • Old Lyme from 13.6 to 15.5
  • Lyme from 9.2 to 9.2

The same report shows that the case numbers in Week 1 and Week 2 respectively and recorded for the period 3/07 to 3/20  (compared with the previous two-week case rate for 2/28 to 3/13 shown in parentheses) are as follows:

  • Lyme had(3) cases in Week 1 and(0) in Week 2
  • Old Lyme had 9 (5) cases in Week 1 and (9) in Week 2

This data was updated March 25, 2021. The next Ledge Light Weekly Data Report for its District will be issued in the afternoon of Thursday, April 1.

Old Lyme – Cumulative Cases Up One

The Daily Data Report for Connecticut issued Thursday, March 25, by the Connecticut Department of Public Health (CT-DPH) for data as at 8:30 p.m. Wednesday, March 24, shows that Old Lyme has a cumulative total (since the outbreak began) of 297 confirmed COVID-19 cases and SEVEN probable casesmaking a TOTAL of 304 cases.

This represents an INCREASE of ONE in the cumulative number of confirmed cases compared with those reported Wednesday, March 24, and NO CHANGE in the number of probable cases.

The total number of Old Lyme residents tested is 4,897, an increase of 11 over Wednesday’s number of 4,888.

Lyme – Cumulative Cases Up One

Lyme has a cumulative total (since the outbreak began) of 87 confirmed cases and 8 probable cases, making a TOTAL of 95 cases.

This represents an INCREASE of ONE in the cumulative number of confirmed cases compared with those reported Wednesday, March 24, and NO CHANGE in the number of probable cases.

The total number of Lyme residents tested is 1,320, an increase of three over Wednesday’s number of 1,317.

Vaccination Rates

At the request of several readers, we have started a new section reflecting the status of community vaccination rates in Lyme and Old Lyme. The data is taken from the COVID-19 Vaccinations by Town report published by CT-DPH, which is published roughly weekly.

Lyme is now ahead of Old Lyme in terms of the percentage of its total population that have received a first dose, with 49.01 percent vaccinated compared with 44.36 percent in Old Lyme. The percentages for both towns for the age segments 65-74 and 75+ are very encouraging with Lyme now having 101.82 percent of seniors 75 and above having received their first dose and 94.84 percent of the same age segment having received it in Old Lyme. Editor’s Note: We are skeptical of these figures for Old Lyme since they show the numbers vaccinated in the two age segments decreasing compared with last week. We are investigating further.

The detailed data below is the most recent and was updated March 245.

Old Lyme
Total population:  7,306
Estimated population age 65-74:  1,067
Estimated population age 75 and above:  794

[table id=12 /]

Lyme
Total population:  2,316
Estimated population age 65-74:  372
Estimated population age 75 and above:  274

[table id=11 /]

Three Fatalities in Old Lyme Since Pandemic Began, None in Lyme

According to the report mentioned above, there have now been THREE fatalities in Old Lyme. Asked Tuesday, Feb. 9, for details of this third fatality, Ledge Light Health Department Director of Health Stephen Mansfield responded, “We have not been notified of any recent deaths in Old Lyme. Keep in mind that that report is compiled by the Connecticut Department of Public Health; deaths are not reportable to local health districts.”

He added, “I can’t speak for their data sources.”

The two fatalities from Old Lyme previously reported in 2020 were a 61-year-old female and an 82-year-old male.

No fatalities have been reported in Lyme.

Connecticut Hospital Occupancy

At the request of several readers, we are adding a new report today showing the respective rates of hospital occupancy at local hospitals. The data for this report is obtained from the Connecticut Hospital Occupancy Report published weekly by the CT DPH and extracted from the United States Department of Health and Human Services (HHS) facility-level data for hospital utilization aggregated on a weekly basis (Friday to Thursday).

[table id=10 /]

Editor’s Note: The state issues a COVID-19 metric report daily around 4 p.m. Monday through Friday, which includes current data up to the previous evening. In light of the ongoing rise in Coronavirus cases, we publish a new weekday update reporting confirmed and probable COVID-19 cases in Lyme and Old Lyme. 

Old Lyme’s Inland Wetlands Commission Continues Public Hearing on Big Y’s Controversial Gas Station/Convenience Store Proposal to Next Month

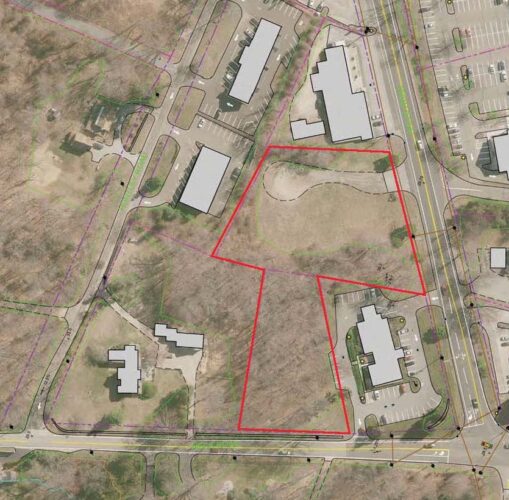
The site of the proposed Big Y Express at the western end of Halls Rd. in Old Lyme. Map courtesy of the Halls Rd. Improvement Committee.

OLD LYME — Around 50 people joined Tuesday’s Public Hearing for the proposal presented by Big Y Foods for a gas station/convenience store at 99 Halls Rd. and 25 Neck Rd., which was hosted Tuesday via Webex by the Old Lyme Inland Wetlands and Watercourses Commission (IWWC).

According to the application submitted to the IWWC, the proposal is for a 2,100 sq. ft. convenience mart and a gas station on a site surrounding Essex Savings Bank that is currently vacant and partially cleared. The application states that the fuel system consists of six dispensers under a protective canopy and two double wall fiberglass underground fuel tanks with electronic monitoring.

The IWWC’s role is to assess whether there is potential for significant impact to the watercourses located on the property proposed for the development. Commission Chairman Rachael Gaudio stressed both at the Feb. 23 meeting of the IWWC and at this meeting that it is not under this commission’s purview to consider zoning, planning or traffic matters.

The Commission had received written responses from the project engineer for the applicant, Ryan Scrittorale, PE, of Alfred Benesch & Co. to comments by the IWWC engineer Thomas Metcalfe and soil scientist Eric Davison of Davison Environmental. These have been published on the Town website at this link.

Since Martin Brogie, of Martin Brogie, Inc., the applicant’s soil scientist, was not able to attend the meeting due to being hospitalized for COVID, the applicant’s attorney, Robin Pearson, requested that the hearing be continued until next month.

The commission heard testimony from Dr. Michael W. Klemens, who has a PhD in Ecology/Conservation Biology. He was introduced by Marjorie Shansky, the attorney representing the intervenor at  85 Halls Road, LLC.

Krewson said that a major problem he was facing in terms of assessing the environmental impact of the proposed project was that “We don’t know where the boundary of the vernal pool is … we need to understand where the vernal pool is … to determine what is present in the vernal pool.” He noted that the most recent data available is from 2006, but emphasized, “There needs to be a lot more detail.”

He noted, “Wood frogs are a unique and special case. They are actually involved in nutrient recycling,” adding, “We need to see robust data on biodata.” Klemens said he would assume, “The majority of the migration comes from the north,” but stressed again, “We need to know [what is at the vernal pool.]”

The owner of the adjoining property Brain Farnham at 29 Neck Rd. responded to comments that he was not permitting access to his property to inspect the vernal pool. He said, “There are diucks in that pond. It’s their breeding season. That’s why I’m resisting people walking on my property.”

Gaudio countered that, as someone who had obtained two bachelor’s degrees, one in Biological Sciences and the second in Wildlife Conservation and Mangement, prior to attending law school and receiving a Masters in Environmental Law and Policy, she understood Farnham’s concerns. She stated, however, “I don’t think a scientist would go out and be a big impact [on the property or duck nests],” noting the inspection would primarily involve walking around the edge of the pool and looking for evidence of wildlife.

Chairman Gaudio agreed to continue the hearing until Tuesday, April 27, at 6 p.m., when it will be held again via Webex. She urged all parties, including members of the public, to submit any further comments by the end of the day on April 26.

The Public hearing will likely be closed on April 27, but the IWWC will not necessarily vote on the proposal at that meeting.

Editor’s Note: The full Minutes of the meeting have now been published on the Town of Old Lyme website at this link.