Old Lyme BOS Say Yes (Hopefully) to Memorial Day Parade, No to Midsummer Fireworks

Will there be a Memorial Day Parade in Old Lyme this year?

OLD LYME — The Old Lyme Board of Selectmen engaged in a lively discussion at their regular meeting yesterday regarding whether the town’s traditional Memorial Day parade should proceed this year. It was cancelled last year due to COVID-19 pandemic.

First Selectman Timothy Griswold noted the Governor’s current Emergency Order regarding the number of people that can gather at an event expires on May 20. Regarding the current situation, he said, “I think they’re talking about a wedding or a sporting event … when you march [in Old Lyme], they’re not packed shoulder to shoulder.”

He noted that the Lyme-Old Lyme (LOL) Middle School Band had indicated a willingness to participate this year but that he had not heard from the LOL High School Band. He also said he had heard that the Boy Scouts would like to march.

Selectwoman Mary Jo Nosal commented, “I’m offended that you didn’t ask the Girl Scouts.”

Indicating general support for having the parade, Griswold added that he was happy to, “Leave it up to individuals to be smart [in terms of masks and social distancing.]”

Selectmen Christopher Kerr stated, “I think the town needs the parade.”

Recognizing general safety concerns and the possibility of a Governor’s order prohibiting the parade due to an uptick in COVID-19 cases, Nosal said, “I’m neutral at this point.”

Griswold then proposed that the board should ask parade organizer Anthony “Tony” Hendricks to ask, “The usual people,” if they are willing to participate and, “Check with the state.” On condition that affirmative responses are received from a majority of the participants and also from the state, he made a motion that the parade should go ahead.

The board of selectmen approved that motion unanimously.

The Town of Old Lyme’s fireworks display traditionally rounds off the Saturday when the Midsummer Festival is held in late July.

The next item on the agenda was whether to have the fireworks display traditionally held at the end of the Old Lyme  Midsummer Festival. The festival itself has already been cancelled by the organizers.

Griswold opened by saying, “I don’t think it’s a good idea. The festival has been cancelled and it’s a lot of money.”

Kerr asked, “Why have the the fireworks if we’re not having the Midsummer Festival?”

Nosal noted that the Hawks Nest neighborhood was considering a fireworks show on a barge and wondered f the Town was supporting that in a monetary fashion. Griswold said the organizers would need to make a specific request to the Old Lyme Board of Finance if they wish to seek town funding.

Nosal also questioned whether the other selectmen had reviewed her proposal made some six months ago for a drone firework display as an alternative to the ‘live’ display, especially since in future years the LOL High School’s new turf field might preclude having the firework display located there.

The selectmen agreed they needed to review the situation for 2022, but voted to cancel the fireworks for this year.

April 5 COVID-19 Update: Old Lyme Cumulative Cases Up One to 314, Lyme Holds at 97

LYME/OLD LYME — The Daily Data Report for Connecticut issued Monday, April 5, by the Connecticut Department of Public Health (CT-DPH) for data as at 8:30 p.m. Sunday, April 4, shows that Old Lyme reported an increase of one new COVID-19 case over the number reported Friday, April 2. Lyme, however,  held steady at the same number of cases as Friday.

Old Lyme reported a total of 314 cases, while, for the third reporting day in a row, Lyme had a total of 97 cumulative cases

These Daily Reports are not issued by CT DPH on Saturday or Sundays and therefore Monday’s data includes new cases from both weekend days.

Old Lyme – Cumulative Cases Up One

TheDaily Data Report for Connecticut issued Monday, April 5, by the CT-DPH for data as at 8:30 p.m. Sunday, April 4, shows that Old Lyme has a cumulative total (since the outbreak began) of 307 confirmed COVID-19 cases and SEVEN probable casesmaking a TOTAL of 314 cases.

This represents an INCREASE of ONE in the cumulative number of confirmed cases and NO CHANGE in the cumulative number of probable cases compared with those reported Friday, April 2.

The total number of Old Lyme residents tested is 4,970, an increase of 22 over Friday’s number of 4,948.

Lyme – No Change in Cumulative Cases

Lyme has a cumulative total (since the outbreak began) of 89 confirmed cases and 8 probable cases, making a TOTAL of 97 cases.

This represents NO CHANGE in the cumulative number of confirmed or probable cases compared with those reported Friday, April 2.

The total number of Lyme residents tested is 1,341, an increase of six over Friday’s number of 1,335.

Two-Week New Case Rates Make Depressing News for State, Local Towns

The report issued Friday, April 2, by the CT DPH for the average daily rate of new cases of COVID-19 by town during the past two weeks contains distressing news for the whole state. This report is issued daily, but only updated weekly on Thursdays. The most recent report was updated Thursday, April 1; the next updated report will be issued in the afternoon of Thursday, April 8.

There are now 146 towns in the state in the Red (highest) Zone for two-week new case rates and these include Old Lyme, which remains in that Zone for the second week in succession.

Lyme, however, is one of only 13 towns in the state in the Gray (lowest) Zone for two-week case rates, recording a third straight week in the lowest zone. (Four zones are specified by the CT DPH — see details below.)

Emphasizing the seriousness of the current situation, the Hartford Courant has today published an article by Alex Putterman titled, Seven-day COVID-19 positivity rate hits highest level in two months as variants spread in Connecticut; hospitalizations up

Overall, the state’s April 1 report contains disappointing news for the whole state with the number of towns in the Gray category staying constant and those in the Yellow and Orange Zones decreasing significantly this week (the previous week’s figures are shown in parentheses), reflecting a statewide  increase in infection rates:

  • 13 (13) towns are now in the (lowest case rate) Gray Zone
  • 2 (5) are in the (lowest but one) Yellow Zone
  • 8 (20) are in the (second highest case rate) Orange Zone.

All the remaining 146 towns are in the Red Zone, and the state as a whole is moving once again towards the map we published in November when every town in the state was in the Red Zone. The numbers are concerning in that the trend appears to be that cases are continuing to increase at this point.

Lyme joins only 12 other towns in the Gray (lowest rate) Zone: Ashford, Canaan, Chaplin, Cornwall, Eastford, Franklin, Hampton, New Canaan, Norfolk, Scotland, Sharon and Warren.

The Yellow (second lowest rate) Zone now has only two towns: Essex and Willington.

The Orange (second highest rate) Zone now has only eight towns, down from 20 in last week’s numbers: Chester, Columbia, East Haddam, East Hampton, Salisbury, Somers, Stonington, Vernon

  • The gray category is defined as when the Average Daily Rate of COVID-19 Cases Among Persons Living in Community Settings per 100,000 Population By Town is less than five or less than five reported cases.
  • The yellow category is defined as when the Average Daily Rate of COVID-19 Cases Among Persons Living in Community Settings per 100,000 Population By Town is between five and nine reported cases.
  • The orange category is defined as when the Average Daily Rate of COVID-19 Cases Among Persons Living in Community Settings per 100,000 Population By Town is between 10 and 14.
  • The red category is defined as when the Average Daily Rate of COVID-19 Cases Among Persons Living in Community Settings per 100,000 Population By Town exceeds 15.

In all cases, this rate does not include cases or tests among residents of nursing home, assisted living, or correctional facilities.

More Detail on Two-Week New Case Rates

LLHD Director of Health Stephen Mansfield

On Thursday, April 1, Ledge Light Health District (LLHD) also issued their latest weekly report of COVID data for the municipalities within their District. Ledge Light Director of Health Stephen Mansfield prefaces the report with the comment, “We continue to see relatively steady case numbers within our jurisdiction. Our contact tracers report clusters associated with daycares, schools, and workplaces, and transmissions linked to social gatherings and sporting events.”

He stresses, however, “Although we are making great strides with our COVID vaccination program, it is still imperative that we remain diligent in our mitigation strategies.”

The latest two-week case rates announced Thursday, April 1 (from 03/14 to 3/27) have remained constant in Old Lyme and increased in Lyme.

The two-week case rates are as follows:

  • Old Lyme from 15.5 to 15.5
  • Lyme from 9.2 to 12.2

The same report shows that the case numbers in Week 1 and Week 2 respectively and recorded for the period 3/14 to 3/27  (compared with the previous two-week case rate for 3/07 to 3/20 shown in parentheses) are as follows:

  • Lyme had(1) cases in Week 1 and(2) in Week 2
  • Old Lyme had 7 (9) cases in Week 1 and (7) in Week 2

This data was updated April 1, 2021. The next Ledge Light Weekly Data Report for its District will be issued in the afternoon of Thursday, April 8.

Vaccination Rates

At the request of several readers, we have started a new section reflecting the status of community vaccination rates in Lyme and Old Lyme. The data is taken from the COVID-19 Vaccinations by Town report published by CT-DPH, which is published roughly weekly.

Lyme is now ahead of Old Lyme in terms of the percentage of its total population that have received a first dose, with 54.36 percent vaccinated compared with 48.63 percent in Old Lyme.

The percentages for both towns for the age segments 65-74 and 75+ are very encouraging with Lyme now having 105.47 percent of seniors 75 and above having received their first dose and 95.09 percent of the same age segment having received it in Old Lyme.

The detailed data below is the most recent and was updated April 1.

Old Lyme
Total population:  7,306
Estimated population age 65-74:  1,067
Estimated population age 75 and above:  794

[table id=12 /]

Lyme
Total population:  2,316
Estimated population age 65-74:  372
Estimated population age 75 and above:  274

[table id=11 /]

Three Fatalities in Old Lyme Since Pandemic Began, None in Lyme

According to the report mentioned above, there have now been THREE fatalities in Old Lyme. Asked Tuesday, Feb. 9, for details of this third fatality, Ledge Light Health Department Director of Health Stephen Mansfield responded, “We have not been notified of any recent deaths in Old Lyme. Keep in mind that that report is compiled by the Connecticut Department of Public Health; deaths are not reportable to local health districts.”

He added, “I can’t speak for their data sources.”

The two fatalities from Old Lyme previously reported in 2020 were a 61-year-old female and an 82-year-old male.

No fatalities have been reported in Lyme.

Connecticut Hospital Occupancy

At the request of several readers, we added a new report showing the respective rates of hospital occupancy at local hospitals. The data for this report is obtained from the Connecticut Hospital Occupancy Report published weekly by the CT DPH and extracted from the United States Department of Health and Human Services (HHS) facility-level data for hospital utilization aggregated on a weekly basis (Friday to Thursday).

Since the most recent report is dated Feb. 19 and no subsequent updates have been issued, we have discontinued publishing this report until a new update is issued.

Editor’s Note: The state issues a COVID-19 metric report daily around 4 p.m. Monday through Friday, which includes current data up to the previous evening. In light of the ongoing rise in Coronavirus cases, we publish a new weekday update reporting confirmed and probable COVID-19 cases in Lyme and Old Lyme. 

April 2 COVID-19 Update: Both Towns Report Same Cumulative Total as Previous Day; Old Lyme at 313, Lyme at 97

Photo by CDC on Unsplash

LYME/OLD LYME — The Daily Data Report for Connecticut issued Friday, April 2, by the Connecticut Department of Public Health (CT-DPH) for data as at 8:30 p.m. Thursday, April 1, shows that both Lyme and Old Lyme reported the same number of COVID-19 cases as the previous day. Lyme had a total of 97 cumulative cases while Old Lyme reported a total of 313.

These Daily Reports are not issued by CT DPH on Saturday or Sundays.

Old Lyme – No Change in Cumulative Cases 

TheDaily Data Report for Connecticut issued Friday, April 2, by the CT-DPH for data as at 8:30 p.m. Thursday, April 1, shows that Old Lyme has a cumulative total (since the outbreak began) of 306 confirmed COVID-19 cases and SEVEN probable casesmaking a TOTAL of 313 cases.

This represents NO CHANGE in the cumulative number of confirmed or probable cases compared with those reported Thursday, March 31.

The total number of Old Lyme residents tested is 4,948, an increase of three over Thursday’s number of 4,945.

Lyme – No Change in Cumulative Cases

Lyme has a cumulative total (since the outbreak began) of 89 confirmed cases and 8 probable cases, making a TOTAL of 97 cases.

This represents NO CHANGE in the cumulative number of confirmed or probable cases compared with those reported Thursday, April 1.

The total number of Lyme residents tested is 1,335, an increase of three over Thursday’s number of 1,332.

Two-Week New Case Rates Make Depressing News for State, Local Towns

The report issued Friday, April 2, by the CT DPH for the average daily rate of new cases of COVID-19 by town during the past two weeks contains distressing news for the whole state. This report is issued daily, but only updated weekly on Thursdays. The most recent report was updated Thursday, April 1; the next updated report will be issued in the afternoon of Thursday, April 8.

There are now 146 towns in the state in the Red (highest) Zone for two-week new case rates and these include Old Lyme, which remains in that Zone for the second week in succession.

Lyme, however, is one of only 13 towns in the state in the Gray (lowest) Zone for two-week case rates, recording a third straight week in the lowest zone. (Four zones are specified by the CT DPH — see details below.)

Emphasizing the seriousness of the current situation, the Hartford Courant has today published an article by Alex Putterman titled, Seven-day COVID-19 positivity rate hits highest level in two months as variants spread in Connecticut; hospitalizations up

Overall, the state’s April 1 report contains disappointing news for the whole state with the number of towns in the Gray category staying constant and those in the Yellow and Orange Zones decreasing significantly this week (the previous week’s figures are shown in parentheses), reflecting a statewide  increase in infection rates:

  • 13 (13) towns are now in the (lowest case rate) Gray Zone
  • 2 (5) are in the (lowest but one) Yellow Zone
  • 8 (20) are in the (second highest case rate) Orange Zone.

All the remaining 146 towns are in the Red Zone, and the state as a whole is moving once again towards the map we published in November when every town in the state was in the Red Zone. The numbers are concerning in that the trend appears to be that cases are continuing to increase at this point.

Lyme joins only 12 other towns in the Gray (lowest rate) Zone: Ashford, Canaan, Chaplin, Cornwall, Eastford, Franklin, Hampton, New Canaan, Norfolk, Scotland, Sharon and Warren.

The Yellow (second lowest rate) Zone now has only two towns: Essex and Willington.

The Orange (second highest rate) Zone now has only eight towns, down from 20 in last week’s numbers: Chester, Columbia, East Haddam, East Hampton, Salisbury, Somers, Stonington, Vernon

  • The gray category is defined as when the Average Daily Rate of COVID-19 Cases Among Persons Living in Community Settings per 100,000 Population By Town is less than five or less than five reported cases.
  • The yellow category is defined as when the Average Daily Rate of COVID-19 Cases Among Persons Living in Community Settings per 100,000 Population By Town is between five and nine reported cases.
  • The orange category is defined as when the Average Daily Rate of COVID-19 Cases Among Persons Living in Community Settings per 100,000 Population By Town is between 10 and 14.
  • The red category is defined as when the Average Daily Rate of COVID-19 Cases Among Persons Living in Community Settings per 100,000 Population By Town exceeds 15.

In all cases, this rate does not include cases or tests among residents of nursing home, assisted living, or correctional facilities.

More Detail on Two-Week New Case Rates

LLHD Director of Health Stephen Mansfield

On Thursday, April 1, Ledge Light Health District (LLHD) also issued their latest weekly report of COVID data for the municipalities within their District. Ledge Light Director of Health Stephen Mansfield prefaces the report with the comment, “We continue to see relatively steady case numbers within our jurisdiction. Our contact tracers report clusters associated with daycares, schools, and workplaces, and transmissions linked to social gatherings and sporting events.”

He stresses, however, “Although we are making great strides with our COVID vaccination program, it is still imperative that we remain diligent in our mitigation strategies.”

The latest two-week case rates announced Thursday, April 1 (from 03/14 to 3/27) have remained constant in Old Lyme and increased in Lyme.

The two-week case rates are as follows:

  • Old Lyme from 15.5 to 15.5
  • Lyme from 9.2 to 12.2

The same report shows that the case numbers in Week 1 and Week 2 respectively and recorded for the period 3/14 to 3/27  (compared with the previous two-week case rate for 3/07 to 3/20 shown in parentheses) are as follows:

  • Lyme had(1) cases in Week 1 and(2) in Week 2
  • Old Lyme had 7 (9) cases in Week 1 and (7) in Week 2

This data was updated April 1, 2021. The next Ledge Light Weekly Data Report for its District will be issued in the afternoon of Thursday, April 8.

Vaccination Rates

At the request of several readers, we have started a new section reflecting the status of community vaccination rates in Lyme and Old Lyme. The data is taken from the COVID-19 Vaccinations by Town report published by CT-DPH, which is published roughly weekly.

Lyme is now ahead of Old Lyme in terms of the percentage of its total population that have received a first dose, with 54.36 percent vaccinated compared with 48.63 percent in Old Lyme.

The percentages for both towns for the age segments 65-74 and 75+ are very encouraging with Lyme now having 105.47 percent of seniors 75 and above having received their first dose and 95.09 percent of the same age segment having received it in Old Lyme.

The detailed data below is the most recent and was updated April 1.

Old Lyme
Total population:  7,306
Estimated population age 65-74:  1,067
Estimated population age 75 and above:  794

[table id=12 /]

Lyme
Total population:  2,316
Estimated population age 65-74:  372
Estimated population age 75 and above:  274

[table id=11 /]

Three Fatalities in Old Lyme Since Pandemic Began, None in Lyme

According to the report mentioned above, there have now been THREE fatalities in Old Lyme. Asked Tuesday, Feb. 9, for details of this third fatality, Ledge Light Health Department Director of Health Stephen Mansfield responded, “We have not been notified of any recent deaths in Old Lyme. Keep in mind that that report is compiled by the Connecticut Department of Public Health; deaths are not reportable to local health districts.”

He added, “I can’t speak for their data sources.”

The two fatalities from Old Lyme previously reported in 2020 were a 61-year-old female and an 82-year-old male.

No fatalities have been reported in Lyme.

Connecticut Hospital Occupancy

At the request of several readers, we added a new report showing the respective rates of hospital occupancy at local hospitals. The data for this report is obtained from the Connecticut Hospital Occupancy Report published weekly by the CT DPH and extracted from the United States Department of Health and Human Services (HHS) facility-level data for hospital utilization aggregated on a weekly basis (Friday to Thursday).

Since the most recent report is dated Feb. 19 and no subsequent updates have been issued, we have discontinued publishing this report until a new update is issued.

Editor’s Note: The state issues a COVID-19 metric report daily around 4 p.m. Monday through Friday, which includes current data up to the previous evening. In light of the ongoing rise in Coronavirus cases, we publish a new weekday update reporting confirmed and probable COVID-19 cases in Lyme and Old Lyme. 

April 1 COVID-19 Update: Old Lyme Stays in Red (Highest) Zone for Two-Week New Case Rate, Lyme in Lowest; OL Holds at 313 Cumulative Cases, Lyme Up One at 97

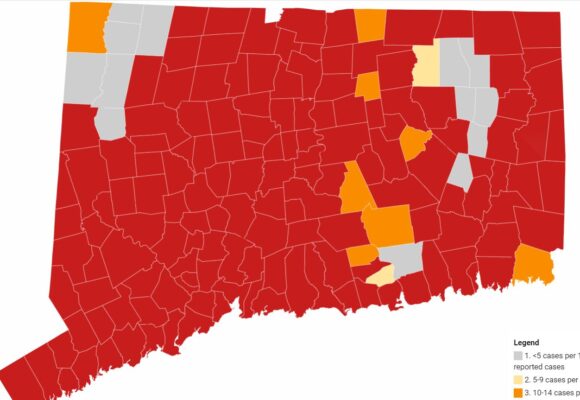
This map, updated April 1, shows the average daily rate of new cases of COVID-19 by town during the past two weeks. The Town of Old Lyme remains in the (highest) Red Zone, while Lyme is still in the (lowest) Gray Zone. (Only cases among persons living in community settings are included in this map; the map does not include cases among people who reside in nursing home, assisted living, or correctional facilities.)

LYME/OLD LYME — The report issued Thursday, April 1, by the Connecticut Department of Public Health (CT DPH) for the average daily rate of new cases of COVID-19 by town during the past two weeks contains distressing news for the whole state.

There are now 146 towns in the state in the Red (highest) Zone for two-week new case rates and these include Old Lyme, which remains in that Zone for the second week in succession.

Lyme, however, is one of only 13 towns in the state in the Gray (lowest) Zone for two-week case rates, recording a third straight week in the lowest zone. (Four zones are specified by the CT DPH — see details below.)

Emphasizing the seriousness of the current situation, the Hartford Courant has today published an article by Alex Putterman titled, Seven-day COVID-19 positivity rate hits highest level in two months as variants spread in Connecticut; hospitalizations up

Overall, the state’s April 1 report contains disappointing news for the whole state with the number of towns in the Gray category staying constant and those in the Yellow and Orange Zones decreasing significantly this week (the previous week’s figures are shown in parentheses), reflecting a statewide  increase in infection rates:

  • 13 (13) towns are now in the (lowest case rate) Gray Zone
  • 2 (5) are in the (lowest but one) Yellow Zone
  • 8 (20) are in the (second highest case rate) Orange Zone.

All the remaining 146 towns are in the Red Zone, and the state as a whole is moving once again towards the map we published in November when every town in the state was in the Red Zone. The numbers are concerning in that the trend appears to be that cases are continuing to increase at this point.

Lyme joins only 12 other towns in the Gray (lowest rate) Zone: Ashford, Canaan, Chaplin, Cornwall, Eastford, Franklin, Hampton, New Canaan, Norfolk, Scotland, Sharon and Warren.

The Yellow (second lowest rate) Zone now has only two towns: Essex and Willington.

The Orange (second highest rate) Zone now has only eight towns, down from 20 in last week’s numbers: Chester, Columbia, East Haddam, East Hampton, Salisbury, Somers, Stonington, Vernon

  • The gray category is defined as when the Average Daily Rate of COVID-19 Cases Among Persons Living in Community Settings per 100,000 Population By Town is less than five or less than five reported cases.
  • The yellow category is defined as when the Average Daily Rate of COVID-19 Cases Among Persons Living in Community Settings per 100,000 Population By Town is between five and nine reported cases.
  • The orange category is defined as when the Average Daily Rate of COVID-19 Cases Among Persons Living in Community Settings per 100,000 Population By Town is between 10 and 14.
  • The red category is defined as when the Average Daily Rate of COVID-19 Cases Among Persons Living in Community Settings per 100,000 Population By Town exceeds 15.

In all cases, this rate does not include cases or tests among residents of nursing home, assisted living, or correctional facilities.

This report is issued daily, but only updated weekly on Thursdays. The most recent report was updated Thursday, April 1; the next updated report will be issued in the afternoon of Thursday, April 8.

More Detail on Two-Week Case Rates

LLHD Director of Health Stephen Mansfield

On Thursday, April 1, Ledge Light Health District (LLHD) also issued their latest weekly report of COVID data for the municipalities within their District. Ledge Light Director of Health Stephen Mansfield prefaces the report with the comment, “We continue to see relatively steady case numbers within our jurisdiction. Our contact tracers report clusters associated with daycares, schools, and workplaces, and transmissions linked to social gatherings and sporting events.”

He stresses, however, “Although we are making great strides with our COVID vaccination program, it is still imperative that we remain diligent in our mitigation strategies.”

The latest two-week case rates announced Thursday, April 1 (from 03/14 to 3/27) have remained constant in Old Lyme and increased in Lyme.

The two-week case rates are as follows:

  • Old Lyme from 15.5 to 15.5
  • Lyme from 9.2 to 12.2

The same report shows that the case numbers in Week 1 and Week 2 respectively and recorded for the period 3/14 to 3/27  (compared with the previous two-week case rate for 3/07 to 3/20 shown in parentheses) are as follows:

  • Lyme had(1) cases in Week 1 and(2) in Week 2
  • Old Lyme had 7 (9) cases in Week 1 and (7) in Week 2

This data was updated April 1, 2021. The next Ledge Light Weekly Data Report for its District will be issued in the afternoon of Thursday, April 8.

Old Lyme – No Change in Cumulative Cases 

The Daily Data Report for Connecticut issued Thursday, April 1, by the Connecticut Department of Public Health (CT-DPH) for data as at 8:30 p.m. Wednesday, March 31, shows that Old Lyme has a cumulative total (since the outbreak began) of 306 confirmed COVID-19 cases and SEVEN probable casesmaking a TOTAL of 313 cases.

This represents NO CHANGE in the cumulative number of confirmed or probable cases compared with those reported Wednesday, March 31.

The total number of Old Lyme residents tested is 4,945, an increase of six over Wednesday’s number of 4,939.

Lyme – Cumulative Cases Up One

Lyme has a cumulative total (since the outbreak began) of 89 confirmed cases and 8 probable cases, making a TOTAL of 97 cases.

This represents an INCREASE of ONE in the cumulative number of confirmed cases compared with those reported Wednesday, March 31, and NO CHANGE in the number of probable cases.

The total number of Lyme residents tested is 1,332, an increase of three over Wednesday’s number of 1,329.

Vaccination Rates

At the request of several readers, we have started a new section reflecting the status of community vaccination rates in Lyme and Old Lyme. The data is taken from the COVID-19 Vaccinations by Town report published by CT-DPH, which is published roughly weekly.

Lyme is now ahead of Old Lyme in terms of the percentage of its total population that have received a first dose, with 54.36 percent vaccinated compared with 48.63 percent in Old Lyme.

The percentages for both towns for the age segments 65-74 and 75+ are very encouraging with Lyme now having 105.47 percent of seniors 75 and above having received their first dose and 95.09 percent of the same age segment having received it in Old Lyme.

The detailed data below is the most recent and was updated April 1.

Old Lyme
Total population:  7,306
Estimated population age 65-74:  1,067
Estimated population age 75 and above:  794

[table id=12 /]

Lyme
Total population:  2,316
Estimated population age 65-74:  372
Estimated population age 75 and above:  274

[table id=11 /]

Three Fatalities in Old Lyme Since Pandemic Began, None in Lyme

According to the report mentioned above, there have now been THREE fatalities in Old Lyme. Asked Tuesday, Feb. 9, for details of this third fatality, Ledge Light Health Department Director of Health Stephen Mansfield responded, “We have not been notified of any recent deaths in Old Lyme. Keep in mind that that report is compiled by the Connecticut Department of Public Health; deaths are not reportable to local health districts.”

He added, “I can’t speak for their data sources.”

The two fatalities from Old Lyme previously reported in 2020 were a 61-year-old female and an 82-year-old male.

No fatalities have been reported in Lyme.

Connecticut Hospital Occupancy

At the request of several readers, we have added a new report showing the respective rates of hospital occupancy at local hospitals. The data for this report is obtained from the Connecticut Hospital Occupancy Report published weekly by the CT DPH and extracted from the United States Department of Health and Human Services (HHS) facility-level data for hospital utilization aggregated on a weekly basis (Friday to Thursday).

The most recent report is dated Feb. 19 and covers the two-week period from 2/12 to 2/18. No subsequent updates have been issued.

[table id=10 /]

Editor’s Note: The state issues a COVID-19 metric report daily around 4 p.m. Monday through Friday, which includes current data up to the previous evening. In light of the ongoing rise in Coronavirus cases, we publish a new weekday update reporting confirmed and probable COVID-19 cases in Lyme and Old Lyme. 

March 31 COVID-19 Update: Cumulative Cases Up Two in Old Lyme to 313, Lyme Holds at 96

Photo by CDC on Unsplash

LYME/OLD LYME — The Daily Data Report for Connecticut issued Wednesday, March 31, by the Connecticut Department of Public Health (CT-DPH) for data as at 8:30 p.m., Tuesday, March 30, shows that cumulative cases (confirmed and probable) since the pandemic began INCREASED BY TWO in Old Lyme to 313, but held steady in Lyme at 96 when compared with the numbers reported Monday, March 29.

Old Lyme – Cumulative Cases Up Two

Tuesday’s report shows that Old Lyme has a cumulative total (since the outbreak began) of 306 confirmed COVID-19 cases and SEVEN probable casesmaking a TOTAL of 313 cases.

This represents an INCREASE of TWO in the cumulative number of confirmed cases compared with those reported Tuesday, March 30, and NO CHANGE in the number of probable cases.

The total number of Old Lyme residents tested is 4,930, an increase of four over Tuesday’s number of 4,935.

Lyme – No Change in Cumulative Cases

Lyme has a cumulative total (since the outbreak began) of 88 confirmed cases and EIGHT probable cases, making a TOTAL of 96 cases.

This represents NO CHANGE in the cumulative number of confirmed or probable cases compared with those reported Tuesday, March 30.

The total number of Lyme residents tested is 1,329, an increase of one compared with Tuesday’s number of 1,328.

Two-Week Case Rates: Old Lyme Back in Red (highest) Zone, Lyme Stays in Gray (lowest) Zone

The report issued Wednesday, March 31, by the Connecticut Department of Public Health (CT DPH) for the average daily rate of new cases of COVID-19 by town during the past two weeks contains worrying news for the whole state including Old Lyme. Lyme, however, continues to maintain the low infection rate reported last week.

The report shows that Old Lyme has moved back into the Red (highest) Zone for two-week new case rates, but Lyme has retained its position in the Gray (lowest) Zone.

Last week, Old Lyme was in the (second highest) Orange Zone and so this change reflects a further increase in the two-week case rate over the previous week. In contrast, Lyme has recorded a second straight week in the lowest zone. (Four zones are specified by the CT DPH — see details below)

Overall, the report contains disappointing news for the whole state with the number of towns in the Gray, Yellow and Orange Zones all decreasing this week (the previous week’s figures are shown in parentheses), reflecting a statewide  increase in infection rates:

  • 13 (22) towns are now in the (lowest case rate) Gray Zone
  • 5 (9) are in the (lowest but one) Yellow Zone
  • 20 (33) are in the (second highest case rate) Orange Zone.

All the remaining 131 towns are in the Red Zone, and the state as a whole is moving once again towards the map we published in November when every town in the state was in the Red Zone. The numbers are concerning in that the trend appears to be that cases are continuing to increase at this point.

Lyme joins only 12 other towns in the Gray (lowest rate) Zone: Ashford, Chaplin, Cornwall, Eastford, Franklin, Hampton, New Canaan, North Stonington, Norfolk, Sharon, Scotland and Sprague.

The Yellow (second lowest rate) Zone now has only five towns: Essex, Griswold, Pomfret, Somers and Willington.

  • The gray category is defined as when the Average Daily Rate of COVID-19 Cases Among Persons Living in Community Settings per 100,000 Population By Town is less than five or less than five reported cases.
  • The yellow category is defined as when the Average Daily Rate of COVID-19 Cases Among Persons Living in Community Settings per 100,000 Population By Town is between five and nine reported cases.
  • The orange category is defined as when the Average Daily Rate of COVID-19 Cases Among Persons Living in Community Settings per 100,000 Population By Town is between 10 and 14.
  • The red category is defined as when the Average Daily Rate of COVID-19 Cases Among Persons Living in Community Settings per 100,000 Population By Town exceeds 15.

In all cases, this rate does not include cases or tests among residents of nursing home, assisted living, or correctional facilities.

This report is issued daily, but only updated weekly on Thursdays. The most recent report was updated Thursday, March 25; the next updated report will be issued in the afternoon of Thursday, April 1.

More Detail on Two-Week Case Rates

LLHD Director of Health Stephen Mansfield

On Thursday, March 25, Ledge Light Health District (LLHD) also issued their latest weekly report of COVID data for the municipalities within their District. Ledge Light Director of Health Stephen Mansfield prefaces the report with the comment, “We continue to see relatively steady case numbers within our jurisdiction. Our contact tracers report clusters associated with daycares, schools, and workplaces, and transmissions linked to social gatherings and sporting events.”

He stresses, however, “Although we are making great strides with our COVID vaccination program, it is still imperative that we remain diligent in our mitigation strategies.”

The latest two-week case rates announced Thursday, March 25, for the period 3/07 to 3/20 per 100,000 population (compared with the previous two-week case rate for 2/28 to 3/13) have again increased in Old Lyme and remained constant in Lyme.

The two-week case rates are as follows:

  • Old Lyme from 13.6 to 15.5
  • Lyme from 9.2 to 9.2

The same report shows that the case numbers in Week 1 and Week 2 respectively and recorded for the period 3/07 to 3/20  (compared with the previous two-week case rate for 2/28 to 3/13 shown in parentheses) are as follows:

  • Lyme had(3) cases in Week 1 and(0) in Week 2
  • Old Lyme had 9 (5) cases in Week 1 and (9) in Week 2

This data was updated March 25, 2021. The next Ledge Light Weekly Data Report for its District will be issued in the afternoon of Thursday, April 1.

Vaccination Rates

At the request of several readers, we have started a new section reflecting the status of community vaccination rates in Lyme and Old Lyme. The data is taken from the COVID-19 Vaccinations by Town report published by CT-DPH, which is published roughly weekly.

Lyme is now ahead of Old Lyme in terms of the percentage of its total population that have received a first dose, with 49.01 percent vaccinated compared with 44.36 percent in Old Lyme. The percentages for both towns for the age segments 65-74 and 75+ are very encouraging with Lyme now having 101.82 percent of seniors 75 and above having received their first dose and 94.84 percent of the same age segment having received it in Old Lyme.

Editor’s Note: We are skeptical of these figures for Old Lyme since they show the numbers vaccinated in the two age segments decreasing compared with last week. We are investigating further.

The detailed data below is the most recent and was updated March 25.

Old Lyme
Total population:  7,306
Estimated population age 65-74:  1,067
Estimated population age 75 and above:  794

[table id=12 /]

Lyme
Total population:  2,316
Estimated population age 65-74:  372
Estimated population age 75 and above:  274

[table id=11 /]

Three Fatalities in Old Lyme Since Pandemic Began, None in Lyme

According to the report mentioned above, there have now been THREE fatalities in Old Lyme. Asked Tuesday, Feb. 9, for details of this third fatality, Ledge Light Health Department Director of Health Stephen Mansfield responded, “We have not been notified of any recent deaths in Old Lyme. Keep in mind that that report is compiled by the Connecticut Department of Public Health; deaths are not reportable to local health districts.”

He added, “I can’t speak for their data sources.”

The two fatalities from Old Lyme previously reported in 2020 were a 61-year-old female and an 82-year-old male.

No fatalities have been reported in Lyme.

Connecticut Hospital Occupancy

At the request of several readers, we have added a new report showing the respective rates of hospital occupancy at local hospitals. The data for this report is obtained from the Connecticut Hospital Occupancy Report published weekly by the CT DPH and extracted from the United States Department of Health and Human Services (HHS) facility-level data for hospital utilization aggregated on a weekly basis (Friday to Thursday).

The most recent report is dated Feb. 19 and covers the two-week period from 2/12 to 2/18. No subsequent updates have been issued.

[table id=10 /]

Editor’s Note: The state issues a COVID-19 metric report daily around 4 p.m. Monday through Friday, which includes current data up to the previous evening. In light of the ongoing rise in Coronavirus cases, we publish a new weekday update reporting confirmed and probable COVID-19 cases in Lyme and Old Lyme.