May 7 COVID-19 Update: One New Case in Old Lyme Takes Cumulative Total to 341, Lyme Holds at 106

Photo by CDC on Unsplash

LYME/OLD LYME —The Daily Data Report for Connecticut issued Friday, May 7, by the Connecticut Department of Public Health(CT-DPH) for data as at 8:30 p.m. Thursday, May 6, shows that Old Lyme increased by one new COVID-19 case since the previous day to 341 while Lyme held at its previous day’s cumulative total of 106.

These Daily Reports are not issued by CT DPH on Saturdays or Sundays and therefore Monday’s data includes new cases from both weekend days. The next new report will be issued in the afternoon of Monday, May 10.

Old Lyme – Cumulative Cases Up One

The May 7 Daily Data Report for Connecticut for data as at 8:30 p.m. Thursday, May 6, shows that Old Lyme has a cumulative total (since the outbreak began) of 330 confirmed COVID-19 cases and 11 probable casesmaking a TOTAL of 341 cases.

This represents an INCREASE of ONE in the cumulative number of confirmed cases and NO CHANGE in the number of probable cases compared with those reported the previous day.

The total number of Old Lyme residents tested is 5,202, an increase of nine over the previous day’s number of 5,193.

Lyme – No Change in Cumulative Cases 

Lyme has a cumulative total (since the outbreak began) of 98 confirmed cases and 8 probable cases, making a TOTAL of 106 cases.

This represents NO CHANGE in the cumulative number of confirmed or probable cases compared with those reported the previous day, and represents the third consecutive reporting day with this number.

The total number of Lyme residents tested is 1,397, which represents an increase of two over the previous day’s number of 1,397.

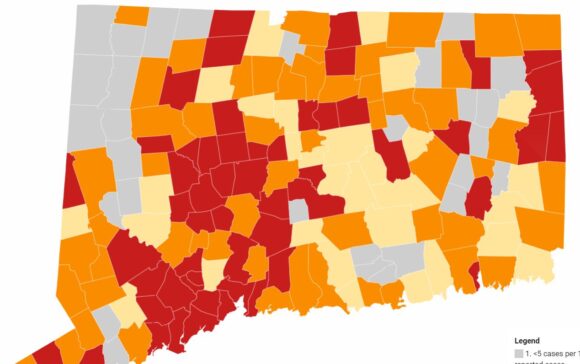
Two-Week New Case Rates Zones: Old Lyme in Yellow, Lyme in Gray

The report issued Thursday, May 6, by the Connecticut Department of Public Health (CT DPH) for the average daily rate of new cases of COVID-19 by town during the past two weeks shows another major improvement for the state as whole with the number of towns remaining in the Red Zone (indicating the highest COVID-19 new case rates) falling to 54 from last week’s number of 97.

During a news conference held Thursday, May 6, Gov. Ned Lamont attributed the decrease in infections to the continuing roll-out of the coronavirus vaccine.

Both Lyme and Old Lyme remain in the zones in which they were placed last week with Old Lyme still in the Yellow (second lowest new case rate) Zone while Lyme remains in the Gray (lowest rate) Zone.

Old Lyme is now one of the 31 towns in the Yellow Zone. Last week, there were 18 towns in this Zone, so this is encouraging news as more towns fall out of the Orange (second highest) Zone.

Lyme is in the Gray Zone for two-week new case rates, recording an eighth straight week in the lowest zone. Twenty-two towns were in this zone last week and, in more good news, this number has increased to 29 this week.

In both cases, the increased total in each Zone reflects a decreased new case rate. (Four zones are specified by the CT DPH — see details below.)

Overall, the number of towns in each zone is shown below with the previous week’s number in parentheses:

  • 29 (22) towns are now in the (lowest case rate) Gray Zone
  • 31 (18) are in the (lowest but one) Yellow Zone
  • 55 (32) are in the (second highest case rate) Orange Zone.

All the remaining 54 towns are in the Red Zone — last week’s number was 97.

Lyme joins 21 other towns in the Gray (lowest rate) Zone: Andover, Bozrah, Bridgewater, Canaan, Chaplin, Chester, Colebrook, Cornwall, Deep River, East Granby, Essex, Franklin, Hampton, Kent, Lisbon, Lyme, Middlefield, Norfolk, Pomfret, Roxbury, Salisbury, Scotland, Sharon, Union, Warren, Washington, Weston, Westport and Willington.

Old Lyme joins 30 other towns in the Yellow (second lowest rate) Zone: Avon, Brooklyn, Clinton, Colchester, Columbia, Darien, Durham, East Haddam, East Hampton, East Lyme, Easton, Glastonbury, Granby, Griswold, Killingworth, Ledyard, Marlborough, New Fairfield, New Hartford, Newington, Portland, Preston, Rocky Hill, Somers, Southbury, Stonington, Tolland, West Hartford, Woodbridge and Woodbury

The Orange (second highest rate) Zone now has 55 towns : Ashford, Beacon Falls, Berlin, Bethany, Bethel, Bethlehem, Bloomfield, Bolton, Branford, Brookfield, Canterbury, Canton, Cheshire, Coventry, Danbury, Ellington, Fairfield, Farmington, Goshen, Greenwich, Groton, Guilford, Haddam, Harwinton, Lebanon, Litchfield, Madison, Mansfield, Montville, New Canaan, New Milford, North Canaan, North Haven, North Stonington, Old Saybrook, Oxford, Redding, Ridgefield, Salem, Simsbury, South Windsor, Sprague, Stafford, Suffield, Thompson, Vernon, Voluntown, Waterford, Westbrook, Wethersfield, Wilton, Winchester, Windsor, Windsor Locks and Woodstock.

  • The Gray category is defined as when the Average Daily Rate of COVID-19 Cases Among Persons Living in Community Settings per 100,000 Population By Town is less than five or less than five reported cases.
  • The Yellow category is defined as when the Average Daily Rate of COVID-19 Cases Among Persons Living in Community Settings per 100,000 Population By Town is between five and nine reported cases.
  • The Orange category is defined as when the Average Daily Rate of COVID-19 Cases Among Persons Living in Community Settings per 100,000 Population By Town is between 10 and 14.
  • The Red category is defined as when the Average Daily Rate of COVID-19 Cases Among Persons Living in Community Settings per 100,000 Population By Town exceeds 15.

In all cases, this rate does not include cases or tests among residents of nursing home, assisted living, or correctional facilities.

This report is issued daily, but only updated weekly on Thursdays. The most recent report was updated Thursday, May 6; the next updated report will be issued in the afternoon of Thursday, May 13.

More Detail on Two-Week Case Rates: Old Lyme Down, Lyme Up

LLHD Director of Health Stephen Mansfield

On Thursday, May 6, Ledge Light Health District (LLHD) also issued their latest weekly report of COVID data for the municipalities within their District.

Ledge Light Director of Health Stephen Mansfield prefaces the report with the comment, “Although the number of new cases remain relatively stable, our contact tracers continue to report clusters, especially those associated with social gatherings and sporting events.”

He stresses, however, “Although we are making great strides with our COVID vaccination program, it is still imperative that we remain diligent in our mitigation strategies.”

The latest Average Daily Case Rate announced Thursday, May 6, (from 4/18 to 5/01) have stayed constant in Old Lyme but decreased in Lyme.

The two-week case rates are as follows:

  • Old Lyme from 9.7 to 9.7
  • Lyme from 9.2 to 6.1

The same report shows that the case numbers in Week 1 and Week 2 respectively and recorded for the period 4/18 to 5/01  (compared with the previous two-week case rate shown in parentheses) are as follows:

  • Lyme had(1) case in Week 1 and(2) in Week 2
  • Old Lyme had(3) cases in Week 1 and(7) in Week 2

This data was updated May 6. The next Ledge Light Weekly Data Report for its District will be issued in the afternoon of Thursday, May 13.

Vaccination Rates

Lyme is ahead of Old Lyme in terms of the percentage of its total population that have received a first dose, with 74.65 (72.06) percent vaccinated compared with 65.56 (63.89) percent in Old Lyme. The previous week’s percentages are shown in parentheses.

The percentages for both towns for the age cohort 65+ are very encouraging with Lyme now having 100 percent of seniors 65 and above fully vaccinated while 97.69 (92.85) percent of the same age cohort are fully vaccinated in Old Lyme.

The percentages for the age cohort 45-64, however, show the numbers reversing with Old Lyme having 57.66 percent fully vaccinated marginally ahead of Lyme at 53.91 percent.

Regarding the age 15-44 cohort, Lyme comes back into the lead again with 37.71 percent fully vaccinated while Old Lyme stands at 33.99 percent.

The state changed its reporting format for vaccination rates on April 15 and their new data does not align precisely with the former data. The detailed data below was partly updated April 29. One change is that the state is now reporting 65 and above as one group, whereas it was previously split into 65-74 and 75 and above. We will present new vaccination rate tables shortly.

Old Lyme
Total population:  7,306
Estimated population age 65-74:  1,067
Estimated population age 75 and above:  794

[table id=12 /]

Lyme
Total population:  2,316
Estimated population age 65-74:  372
Estimated population age 75 and above:  274

[table id=11 /]

Three Fatalities in Old Lyme Since Pandemic Began, None in Lyme

According to the report mentioned above, there have now been THREE fatalities in Old Lyme. Asked Tuesday, Feb. 9, for details of this third fatality, Ledge Light Health Department Director of Health Stephen Mansfield responded, “We have not been notified of any recent deaths in Old Lyme. Keep in mind that that report is compiled by the Connecticut Department of Public Health; deaths are not reportable to local health districts.”

He added, “I can’t speak for their data sources.”

The two fatalities from Old Lyme previously reported in 2020 were a 61-year-old female and an 82-year-old male.

No fatalities have been reported in Lyme.

Connecticut Hospital Occupancy

At the request of several readers, we have added a new report showing the respective rates of hospital occupancy at local hospitals. The data for this report is obtained from the Connecticut Hospital Occupancy Report published weekly by the CT DPH and extracted from the United States Department of Health and Human Services (HHS) facility-level data for hospital utilization aggregated on a weekly basis (Friday to Thursday).

The most recent report is dated Feb. 19 and covers the two-week period from 2/12 to 2/18. No subsequent updates have been issued.

[table id=10 /]

Editor’s Note: The state issues a COVID-19 metric report daily around 4 p.m. Monday through Friday, which includes current data up to the previous evening. In light of the ongoing rise in Coronavirus cases, we publish a new weekday update reporting confirmed and probable COVID-19 cases in Lyme and Old Lyme. 
Duck River Garden Club’s Plant Sale Continues Today in Old Lyme

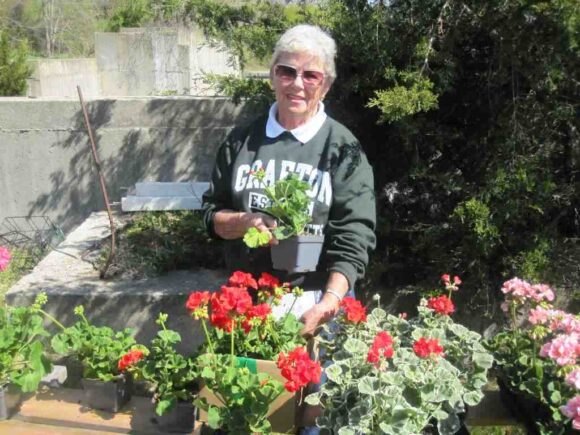
Geraniums and more will be on sale at the Duck River Garden Club’s Annual Plant Sale, which is being held May 7-8, with COVID-19 restrictions in place.

OLD LYME — The Duck River Garden Club will hold its traditional Plant Sale Friday, May 7, from 12 to 7 p.m. and Saturday, May 8, from 9 a.m. to 1 p.m. at 19 Halls Rd. in the parking lot in front of The Hideaway.

In light of COVID-19 restrictions, the sale will be a little different this year. It cannot be the  feeling and touching of foliage of years gone by, but there will still be a good selection of quality plants. This year, customers will be doing more pointing than touching!
The in-person sale will include a collection of annuals, herbs, vegetables, geraniums, hanging pots, perennials, including a selection of native perennials, plus information from Pollinate Old Lyme! on hand, and members’ plants.
In terms of pre-orders, there is an April 30 deadline for new plant combos and ever-popular geraniums. Check out the combos on the order form – four different pre-packed sets of annuals – Sun Combo/Pollinator Powerhouse, another Sun Combo of bold flower colors, and two Shade Combos. There are also two vegetable combos – Lettuce & Tomatoes and the Classic Vegetable Combo, an assortment of squashes, eggplant and pepper.; plus a Herb Combo.
People can order these combos and geraniums for curb-side pick-up or DRGC members will  deliver these to Old Lyme residents.
The order form is available at this link:  https://www.oldlymeduckrivergc.org/events.
The form should be downloaded, printed, completed and mailed with a check to DRGC, PO Box 4116, Old Lyme, CT 06371.

In-person shopping options will include hanging baskets (great Mother’s Day gifts), a special selection of native pollinator-friendly perennials, plus other popular perennials and members plants.

Native pollinator perennials and member’s plants will be available first come-first served during sales hours only (no trying to sneak in early this year!)
Due to COVID safety protocols, plants and payment areas will be spaced out and Ledge Light Health District, Town of Old Lyme at State of CT health/safety requirements will be followed.
There will be no sales of home-made bakery treats or goods from the gardener’s shed this year.
The DRGC members are looking forward to seeing community members again.

A View From My Porch: Epic Poems of Folk and Rock Part 2 

In my previous essay, I discussed a few contemporary works of folk music, that, in my opinion, are natural successors to the epic poems of antiquity. I continue the “epic poems” theme in this essay, but shift to the epic works of conflict; focusing on the rock and roll genre, as influenced by the Vietnam War, which remains in my memory as a chaotic and tragic period of American foreign policy history. 

However, discussions regarding ending the war in Afghanistan, America’s longest war, are again underway; and so, it may be a good time to revisit how we ended what will, consequently, become “America’s Second Longest War”. 

Returning to the original theme, songs that were inspired by past conflicts include “Yankee Doodle” (mid-1700s); “When Johnny Comes Marching Home” (1863); “Over There” (1917); “We’ll Meet Again” (1939); and “Boogie Woogie Bugle Boy” (1941).

In advance of reviewing the songbook of the Vietnam War, I provide, in the following, an overview of how the United States became entangled in Vietnam. 

However, my goal is to present the War at the “boots on the ground” level; i.e., from the perspective of the “grunts and jarheads”. Note that these are not insulting terms. In Vietnam, ‘grunts’ were U.S. Army and Marine Corps infantrymen, or foot soldiers. ‘Jarheads’, on the other hand, are USMC personnel of any rank; and the term is an homage to the high and tight haircuts worn by Marines.

I don’t feel that you can appreciate the music without understanding the war.

Vietnam: The War formerly known as “America’s Longest” (1954 to 1975)

The war in Vietnam was extraordinarily unpopular with Americans. There was no “Pearl Harbor” or “Nine-Eleven” at its beginning; and most Americans probably had only limited knowledge of that part of Asia. Vietnam was the first truly televised war. Camera crews were on-site almost continually; and journalists often recorded their coverage right in the field. Thus, Americans had a very realistic view of the devastation and violence of the War. 

The Threat of Falling Dominoes:

This map shows the partition of French Indochina after partition under the 1954 Geneva Conference. This file by SnowFire is licensed under the Creative Commons Attribution-Share Alike 4.0 license.

After armed forces led by communist leader, Ho Chi Minh, defeated French colonial forces in 1954, and ended nearly 75 years of French colonial rule, world and regional leaders passed the Geneva Accords, which divided Vietnam into the communist North and a more democratic South. 

President Eisenhower warned that the situation in Vietnam was like, “a falling domino, whose loss would lead to rapid and widespread communist victories in neighboring countries.”

Ho Chi Minh then sought to unify the two Vietnams under his communist regime; and precipitated the conflict that placed North Vietnam, with its Viet Cong allies in the South, against South Vietnam and its principal ally, the United States. 

The United States provided funding, armaments, and training to South Vietnam’s government and its military. Unfortunately, tensions rapidly escalated into widespread armed conflict, and President Kennedy expanded our military aid and committed to deploy soldiers to the region.

In his 1961 inaugural address, Kennedy had stated his belief that “U.S. security may be lost piece to piece, country by country, as the result of the domino effect”.

After Kennedy’s death in 1963, his successor, Lyndon Baines Johnson, continued down the same path, and further increased troop deployments. 

“Domino” was then used by successive administrations to justify continued escalation of our involvement in Vietnam. Note that Congress never declared war, and never formally gave the President the authority to escalate our presence in Vietnam until early 1964; and only after the “Gulf of Tonkin Incident”, during which the North Vietnamese fired on two American ships in international waters. 

At the same time, the Soviet Union and China were pouring weapons and supplies into the North; and providing combat troops for North Vietnam’s campaign against the South. 

By 1969, more than 500,000 U.S. military personnel were stationed in Vietnam, and the bulging costs and casualties of the war finally proved too much for Americans to endure, and a poorly-conceived peace agreement was negotiated by the Nixon Administration’s national security advisor, Henry Kissinger, in 1972.

The Paris Peace Accords resulted in the withdrawal of all U.S. and allied forces, the release of Americans who were prisoners of war, and a very loose cease fire, which was almost immediately violated.

The end of the Vietnam War actually occurred on April 30, 1975, after the Saigon government surrendered to the North. Over the next 12 months, North and South were formally united under the control of North Vietnam’s communist government, becoming the Socialist Republic of Vietnam.

Vietnam has estimated that nearly 2 million civilians (i.e., both North and South) perished; and over a million North Vietnamese and Viet Cong fighters were killed. The U.S. military estimates that nearly 250,000 South Vietnamese soldiers died in the war.

The American Soldier in Vietnam:

Between 1964 and 1973, the U.S. military drafted 2.2 million American men from an eligible pool of about 27 million. Historian, Christian Appy, observes, in “Working-Class War”, that the average U.S. soldier was 19-years-old, and from a poor or working-class family, and had not attended college.

A large portion of U.S. troops were African-American men from the inner cities, boys from farming communities, and the sons of immigrants from factory towns. Many of these men enlisted or were drafted right out of high school. 

These young soldiers found themselves in a land of intense heat and humidity, flooded fields, and dense jungles. It could rain nonstop for days at a time during monsoon season. 

They were not welcomed by the local farmers and villagers, but viewed with distrust or hostility. To the Vietnamese, this was the “Resistance War Against America”. 

The fighting conditions in Vietnam were “dreadful” and strained our military tacticians. Unlike past conflicts, Vietnam combat was not “conventional”; rather, it was guerrilla warfare; and the jungles made this form of attack very effective. Tactics included ambushes, sabotage, “hit-and-run” raids on our supply operations, and booby traps. Some civilians, including women and children, actively assisted the Viet Cong guerillas.

A US “tunnel rat” soldier prepares to enter a Viet Cong tunnel. Public domain.

An additional problem was the extensive underground system of tunnels, which was used by the Viet Cong; and “tunnel rat” became an unofficial specialty for those who cleared and destroyed enemy tunnel complexes.

The final Vietnam War tally was 58,148 killed and 75,000 severely disabled. Of those killed, nearly two-thirds were younger than 21-years-old; and the Marines accounted for a third of all American casualties.

Many of our servicemen were exposed to the chemical defoliant, Agent Orange; and hundreds of thousands of Vietnam veterans have died from their exposure to dioxin, the deadly toxin in Agent Orange. Dioxin can cause multiple cancers, peripheral neuropathy, and has also been linked to an elevated risk for Parkinson’s Disease. 

Epics of the Vietnam War Era:

“Stars and Stripes”, the daily independent news source for the military, named Vietnam “the first rock and roll war”. It was the Sixties, these were young men, and the songbook was immense. 

In the next essay, I will review a series of songs from that era that provide some insight into how many Americans responded to the War and expressed their opposition. 

Editor’s Note: This is the opinion of Thomas D. Gotowka.

Author’s Notes: On April 25, 2021 the New York Times reported 571,753 COVID deaths in the United States; nearly a ten-fold increase over our Vietnam War combat deaths. I recall how intense our response was to Vietnam casualty reports, which were eventually updated almost daily on the then still-trusted evening news. I don’t believe that we’ve ever mourned COVID deaths with that same passion.

Anti-Vietnam War protests increased remarkably in the United States through the 1960s, and the draft became the focus of organized resistance. Despite our technological advantages, larger forces, and better weapons, the Viet Cong were able to hold us off and prevent the United States from achieving any sort of victory in Vietnam from winning.

The public was never really in support of the war.

Tragically, our returning soldiers were often treated with contempt. These servicemen usually did a one-year tour of duty. Men came back from Vietnam by themselves rather than with their units; and, as one soldier shipped out, another returned home.

I served during the Vietnam War era, but the entirety of my active duty was at the Naval Hospital at NAS Pax River, MD. My patients were primarily Naval Aviators, and their ground or flight deck support, returning from or going to the war zone.

At the very least, in 1982, the Vietnam Veterans Memorial was dedicated in Washington, D.C., inscribed with the names of 57,939 members of U.S. armed forces, who had died or were missing as a result of the war.

My close childhood friend was killed in action, and his name, Gary John Shea, is engraved on Panel 61E Line 2 of the Memorial. I have seen the engraving.

Tom Gotowka

About the author: Tom Gotowka’s entire adult career has been in healthcare. He’ will sit on the Navy side at the Army/Navy football game. He always sit on the crimson side at any Harvard/Yale contest. He enjoys reading historic speeches and considers himself a scholar of the period from FDR through JFK.

A child of AM Radio, he probably knows the lyrics of every rock and roll or folk song published since 1960. He hopes these experiences give readers a sense of what he believes “qualify” him to write this column.

Letter to the Editor: Turnout for LOL School Budget May Have Been Low, But Canceling In-Person Voting is Start of ‘Slippery Slope’

To the Editor:

We applaud the overwhelming support for the Lyme-Old Lyme Schools proposed 2021-22 budget at the May 4th referendum. Unfortunately, turnout was only about 5 percent.

We realize that there was some expectation of both approval and low turnout; and, as such, at least one elected official recommended that the in-person vote be canceled, and just allow the BOE to approve the school budget.

Doing so creates a very “slippery slope”, whereupon we have set a precedent that enables future cancellation of referenda when “we all know what the outcome will be, anyways”.

We are in an era of American history when well-meaning politicians are implementing some “Orwellian” changes in voter rules and procedures in an effort to improve voter “integrity”, a problem that doesn’t really seem to exist in the United States as a whole, and was largely disproven, after the 2016 election, via numerous recounts; and repeated decisions in the courts. Even the threat to “release the Kraken” had no impact.

Like beauty, voter fraud exists only in the eye of the beholder, which, in this case, was the losing political party, who has not yet put the specious issue behind them.

Sincerely,

Christina J. Gotowka,
Thomas D. Gotowka,
Old Lyme.

May 6 COVID-19 Update: Case Rates Fall Statewide; Lyme, Old Lyme Stay in Same Lower Rate Zones; No Change in Daily Cumulative Case Counts in Either Town

This map, updated May 6, shows the average daily rate of new cases of COVID-19 by town during the past two weeks. The Town of Old Lyme is now in the Yellow (second lowest) Zone, while Lyme stays in the (lowest) Gray Zone. (Only cases among persons living in community settings are included in this map; the map does not include cases among people who reside in nursing home, assisted living, or correctional facilities.)  Source: CT Department of Public Health Get the data Created with Datawrapper

LYME/OLD LYME — The report issued Thursday, May 6, by the Connecticut Department of Public Health (CT DPH) for the average daily rate of new cases of COVID-19 by town during the past two weeks shows another major improvement for the state as whole with the number of towns remaining in the Red Zone (indicating the highest COVID-19 new case rates) falling to 54 from last week’s number of 97.

During a news conference held Thursday, May 6, Gov. Ned Lamont attributed the decrease in infections to the continuing roll-out of the coronavirus vaccine.

Both Lyme and Old Lyme remain in the zones in which they were placed last week with Old Lyme still in the Yellow (second lowest new case rate) Zone while Lyme remains in the Gray (lowest rate) Zone.

Old Lyme is now one of the 31 towns in the Yellow Zone. Last week, there were 18 towns in this Zone, so this is encouraging news as more towns fall out of the Orange (second highest) Zone.

Lyme is in the Gray Zone for two-week new case rates, recording an eighth straight week in the lowest zone. Twenty-two towns were in this zone last week and, in more good news, this number has increased to 29 this week.

In both cases, the increased total in each Zone reflects a decreased new case rate. (Four zones are specified by the CT DPH — see details below.)

Overall, the number of towns in each zone is shown below with the previous week’s number in parentheses:

  • 29 (22) towns are now in the (lowest case rate) Gray Zone
  • 31 (18) are in the (lowest but one) Yellow Zone
  • 55 (32) are in the (second highest case rate) Orange Zone.

All the remaining 54 towns are in the Red Zone — last week’s number was 97.

Lyme joins 21 other towns in the Gray (lowest rate) Zone: Andover, Bozrah, Bridgewater, Canaan, Chaplin, Chester, Colebrook, Cornwall, Deep River, East Granby, Essex, Franklin, Hampton, Kent, Lisbon, Lyme, Middlefield, Norfolk, Pomfret, Roxbury, Salisbury, Scotland, Sharon, Union, Warren, Washington, Weston, Westport and Willington.

Old Lyme joins 30 other towns in the Yellow (second lowest rate) Zone: Avon, Brooklyn, Clinton, Colchester, Columbia, Darien, Durham, East Haddam, East Hampton, East Lyme, Easton, Glastonbury, Granby, Griswold, Killingworth, Ledyard, Marlborough, New Fairfield, New Hartford, Newington, Portland, Preston, Rocky Hill, Somers, Southbury, Stonington, Tolland, West Hartford, Woodbridge and Woodbury

The Orange (second highest rate) Zone now has 55 towns : Ashford, Beacon Falls, Berlin, Bethany, Bethel, Bethlehem, Bloomfield, Bolton, Branford, Brookfield, Canterbury, Canton, Cheshire, Coventry, Danbury, Ellington, Fairfield, Farmington, Goshen, Greenwich, Groton, Guilford, Haddam, Harwinton, Lebanon, Litchfield, Madison, Mansfield, Montville, New Canaan, New Milford, North Canaan, North Haven, North Stonington, Old Saybrook, Oxford, Redding, Ridgefield, Salem, Simsbury, South Windsor, Sprague, Stafford, Suffield, Thompson, Vernon, Voluntown, Waterford, Westbrook, Wethersfield, Wilton, Winchester, Windsor, Windsor Locks and Woodstock.

  • The Gray category is defined as when the Average Daily Rate of COVID-19 Cases Among Persons Living in Community Settings per 100,000 Population By Town is less than five or less than five reported cases.
  • The Yellow category is defined as when the Average Daily Rate of COVID-19 Cases Among Persons Living in Community Settings per 100,000 Population By Town is between five and nine reported cases.
  • The Orange category is defined as when the Average Daily Rate of COVID-19 Cases Among Persons Living in Community Settings per 100,000 Population By Town is between 10 and 14.
  • The Red category is defined as when the Average Daily Rate of COVID-19 Cases Among Persons Living in Community Settings per 100,000 Population By Town exceeds 15.

In all cases, this rate does not include cases or tests among residents of nursing home, assisted living, or correctional facilities.

This report is issued daily, but only updated weekly on Thursdays. The most recent report was updated Thursday, May 6; the next updated report will be issued in the afternoon of Thursday, May 13.

More Detail on Two-Week Case Rates: Old Lyme Down, Lyme Up

LLHD Director of Health Stephen Mansfield

On Thursday, May 6, Ledge Light Health District (LLHD) also issued their latest weekly report of COVID data for the municipalities within their District.

Ledge Light Director of Health Stephen Mansfield prefaces the report with the comment, “Although the number of new cases remain relatively stable, our contact tracers continue to report clusters, especially those associated with social gatherings and sporting events.”

He stresses, however, “Although we are making great strides with our COVID vaccination program, it is still imperative that we remain diligent in our mitigation strategies.”

The latest Average Daily Case Rate announced Thursday, May 6, (from 4/18 to 5/01) have stayed constant in Old Lyme but decreased in Lyme.

The two-week case rates are as follows:

  • Old Lyme from 9.7 to 9.7
  • Lyme from 9.2 to 6.1

The same report shows that the case numbers in Week 1 and Week 2 respectively and recorded for the period 4/18 to 5/01  (compared with the previous two-week case rate shown in parentheses) are as follows:

  • Lyme had(1) case in Week 1 and(2) in Week 2
  • Old Lyme had(3) cases in Week 1 and(7) in Week 2

This data was updated May 6. The next Ledge Light Weekly Data Report for its District will be issued in the afternoon of Thursday, May 13.

Old Lyme – No Change in Cumulative Cases

The May 6 Daily Data Report for Connecticut for data as at 8:30 p.m. Tuesday, May 4, shows that Old Lyme has a cumulative total (since the outbreak began) of 329 confirmed COVID-19 cases and 11 probable casesmaking a TOTAL of 340 cases.

This represents an NO CHANGE in the cumulative number of confirmed or probable cases compared with those reported the previous day.

The total number of Old Lyme residents tested is 5,193, an increase of three over the previous day’s number of 5,190.

Lyme – No Change in Cumulative Cases 

Lyme has a cumulative total (since the outbreak began) of 98 confirmed cases and 8 probable cases, making a TOTAL of 106 cases.

This represents NO CHANGE in the cumulative number of confirmed or probable cases compared with those reported the previous day, and represents the third consecutive reporting day with this number.

The total number of Lyme residents tested is 1,395, which represents no change over the previous day’s number.

Vaccination Rates

Lyme is ahead of Old Lyme in terms of the percentage of its total population that have received a first dose, with 74.65 (72.06) percent vaccinated compared with 65.56 (63.89) percent in Old Lyme. The previous week’s percentages are shown in parentheses.

The percentages for both towns for the age cohort 65+ are very encouraging with Lyme now having 100 percent of seniors 65 and above fully vaccinated while 97.69 (92.85) percent of the same age cohort are fully vaccinated in Old Lyme.

The percentages for the age cohort 45-64, however, show the numbers reversing with Old Lyme having 57.66 percent fully vaccinated marginally ahead of Lyme at 53.91 percent.

Regarding the age 15-44 cohort, Lyme comes back into the lead again with 37.71 percent fully vaccinated while Old Lyme stands at 33.99 percent.

The state changed its reporting format for vaccination rates on April 15 and their new data does not align precisely with the former data. The detailed data below was partly updated April 29. One change is that the state is now reporting 65 and above as one group, whereas it was previously split into 65-74 and 75 and above. We will present new vaccination rate tables shortly.

Old Lyme
Total population:  7,306
Estimated population age 65-74:  1,067
Estimated population age 75 and above:  794

[table id=12 /]

Lyme
Total population:  2,316
Estimated population age 65-74:  372
Estimated population age 75 and above:  274

[table id=11 /]

Three Fatalities in Old Lyme Since Pandemic Began, None in Lyme

According to the report mentioned above, there have now been THREE fatalities in Old Lyme. Asked Tuesday, Feb. 9, for details of this third fatality, Ledge Light Health Department Director of Health Stephen Mansfield responded, “We have not been notified of any recent deaths in Old Lyme. Keep in mind that that report is compiled by the Connecticut Department of Public Health; deaths are not reportable to local health districts.”

He added, “I can’t speak for their data sources.”

The two fatalities from Old Lyme previously reported in 2020 were a 61-year-old female and an 82-year-old male.

No fatalities have been reported in Lyme.

Connecticut Hospital Occupancy

At the request of several readers, we have added a new report showing the respective rates of hospital occupancy at local hospitals. The data for this report is obtained from the Connecticut Hospital Occupancy Report published weekly by the CT DPH and extracted from the United States Department of Health and Human Services (HHS) facility-level data for hospital utilization aggregated on a weekly basis (Friday to Thursday).

The most recent report is dated Feb. 19 and covers the two-week period from 2/12 to 2/18. No subsequent updates have been issued.

[table id=10 /]

Editor’s Note: The state issues a COVID-19 metric report daily around 4 p.m. Monday through Friday, which includes current data up to the previous evening. In light of the ongoing rise in Coronavirus cases, we publish a new weekday update reporting confirmed and probable COVID-19 cases in Lyme and Old Lyme.