
March 5 COVID-19 Update: Cumulative Cases in Old Lyme Rise by One to 283, Lyme Holds at 89

Photo by CDC on Unsplash

LYME/OLD LYME — The Daily Data Report for Connecticut issued Friday, March 5, by the Connecticut Department of Public Health(CT DPH) for data as at 8:30 p.m., Thursday, March 4, shows that cumulative cases (confirmed and probable) since the pandemic began increased by one in Old Lyme to 283 but showed no change in Lyme at 89 when compared with the previous day’s numbers.

The next CT DPH Daily Data Report for Connecticut will be issued in the afternoon of Monday, March 8.

Old Lyme – Cumulative Cases Up One

Old Lyme has a cumulative total (since the outbreak began) of 277 confirmed COVID-19 cases and SIX probable casesmaking a TOTAL of 283 cases.

This represents an INCREASE of ONE in the cumulative number of confirmed cases and NO CHANGE in the number of probable cases compared with those reported Thursday, March 4.

The total number of Old Lyme residents tested is 4,744, up eight from the previous day’s number of 4,738.

Lyme – No Change in Cumulative Cases

Lyme has a cumulative total (since the outbreak began) of 82 confirmed cases and 7 probable cases, making a TOTAL of 89 cases.

This represents NO CHANGE in the cumulative number of confirmed or probable cases compared with those reported Thursday, March 4.

The total number of Lyme residents tested is 1,275, an increase of three over Thursday’s number of 1,272.

Old Lyme Now in Gray (Lowest) Zone for Two-Week New Case Rate, Lyme Remains in (Highest) Red Zone

The report issued Friday, March 5, by the Connecticut Department of Public Health (CT DPH) for the average daily rate of new cases of COVID-19 by town during the past two weeks contains good news for Old Lyme … but not Lyme.

This report is issued daily, but only updated weekly on Thursdays. The most recent report was updated Thursday, March 4: the next updated report will be issued in the afternoon of Thursday, March 11.

It shows that Old Lyme has moved from the (second lowest) Yellow Zone down into the (lowest) Gray Zone reflecting an even lower case rate than the previous week.

Unfortunately, Lyme remains in the ‘Red Zone’ — the category with the highest rate of new cases.

(Four zones are specified by the CT DPH — see details below)

Overall, the report contains good news for the whole state with the number of towns in each Zone increasing this week in every case (the previous week’s figures shown in parentheses):

  • 18 (10) towns are now in the (lowest case rate) Gray Zone
  • 10 (7) are in the (lowest but one) Yellow Zone
  • 36 (28) are in the (second highest case rate) Orange Zone.

All the remaining towns are in the Red Zone, but this represents a dramatic improvement from the map published in November when every town in the state was in the Red Zone.

This report shows that Old Lyme now joins 17 other towns — Barkamsted, Bethlehem, Bridgewater, Canaan, Chester, Colebrook, Cornwall, Eastford, Franklin, Hartland, Morris, Norfolk, Roxbury, Scotland, Sharon, Voluntown and Warren — in the Gray (lowest rate)  Zone.

The Yellow (second lowest rate) Zone includes Bolton, Canton, Easton, Farmington, Granby, New Hartford, Plymouth, Tolland, Woodbury and Willington.

  • The gray category is defined as when the Average Daily Rate of COVID-19 Cases Among Persons Living in Community Settings per 100,000 Population By Town is less than five or less than five reported cases.
  • The yellow category is defined as when the Average Daily Rate of COVID-19 Cases Among Persons Living in Community Settings per 100,000 Population By Town is between five and nine reported cases.
  • The orange category is defined as when the Average Daily Rate of COVID-19 Cases Among Persons Living in Community Settings per 100,000 Population By Town is between 10 and 14.
  • The red category is defined as when the Average Daily Rate of COVID-19 Cases Among Persons Living in Community Settings per 100,000 Population By Town exceeds 15.

In all cases, this rate does not include cases or tests among residents of nursing home, assisted living, or correctional facilities.

More Detail on Two-Week Case Rates

LLHD Director of Health Stephen Mansfield

On Thursday, March 4, Ledge Light Health District (LLHD) also issued their latest weekly report of COVID data for the municipalities within their District. Ledge Light Director of Health Stephen Mansfield prefaces the report with the comment, “We are encouraged to see relatively steady numbers within our jurisdiction.’

He stresses, however, “Although we are making great strides with our COVID vaccination program, it is still imperative that we remain diligent in our mitigation strategies.”

The latest two-week case rates announced Thursday, March 4, for the period 2/14 to 2/27 per 100,000 population (compared with the previous two-week case rate for 2/07 to 2/20) have fallen in both Old Lyme and Lyme.

The two-week case rates are as follows:

  • Old Lyme from 6.8 to 4.8
  • Lyme from 24.4 to 15.3

The same report shows that the case numbers in Week 1 and Week 2 respectively and recorded for the period 2/14 to 2/27  (compared with the previous two-week case rate for 2/07 to 2/20 shown in parentheses) are as follows:

  • Lyme had(5) cases in Week 1 and 3 (3) in Week 2
  • Old Lyme had 2 (4) cases in Week 1 and 3 (3) in Week 2

This data was updated March 4, 2021. The next Ledge Light Weekly Data Report for its District will be issued in the afternoon of Thursday, March 11.

Three Fatalities in Old Lyme Since Pandemic Began, None in Lyme

According to the report mentioned above, there have now been THREE fatalities in Old Lyme. Asked Tuesday, Feb. 9, for details of this third fatality, Ledge Light Health Department Director of Health Stephen Mansfield responded, “We have not been notified of any recent deaths in Old Lyme. Keep in mind that that report is compiled by the Connecticut Department of Public Health; deaths are not reportable to local health districts.”

He added, “I can’t speak for their data sources.”

The two fatalities from Old Lyme previously reported in 2020 were a 61-year-old female and an 82-year-old male.

No fatalities have been reported in Lyme.

Connecticut Hospital Occupancy

At the request of several readers, we are adding a new report today showing the respective rates of hospital occupancy at local hospitals. The data for this report is obtained from the Connecticut Hospital Occupancy Report published weekly by the CT DPH and extracted from the United States Department of Health and Human Services (HHS) facility-level data for hospital utilization aggregated on a weekly basis (Friday to Thursday).

[table id=10 /]

Editor’s Note: The state issues a COVID-19 metric report daily around 4 p.m. Monday through Friday, which includes current data up to the previous evening. In light of the serious rise in Coronavirus cases, we publish a new weekday update reporting confirmed and probable COVID-19 cases in Lyme and Old Lyme. 

Basketball Update: Old Lyme Boys Steal Last Minute 50-47 Win Over Coginchaug

LYME/OLD LYME — In a thrilling game played away Saturday in the Coginchaug gym, the Old Lyme boys ultimately outlasted Coginchaug 50-47 in a tightly contested Shoreline Conference game.
Caden Monte his a jump shot with less than a minute to go to give Old Lyme the lead at 48-47 and Jacob Ritchie added two free throws with five seconds left for the final victory.
Coginchaug had a last second look at three points on the buzzer, which would have tied the game, but — for the Coginchaug fans — excruciatingly, it bounced out.
Leading the Wildcats was Jacob Ritchie with 16 points, Colbe Andrews was close behind with 13 and Frank Sablone added 10.
Coginchaug was led by AJ Defilio with 17 points, Tyler Garratson 13, and Jaysen Penney 11.
The boys meet Valley this evening away with a 5:30 p.m. tip-off.

March 4 COVID-19 Update: Lyme Stays in (Highest) Red Zone for Two-Week Case Rate, Old Lyme Falls to Lowest (Gray); Cumulative Cases Climb in OL to 282, Lyme to 89

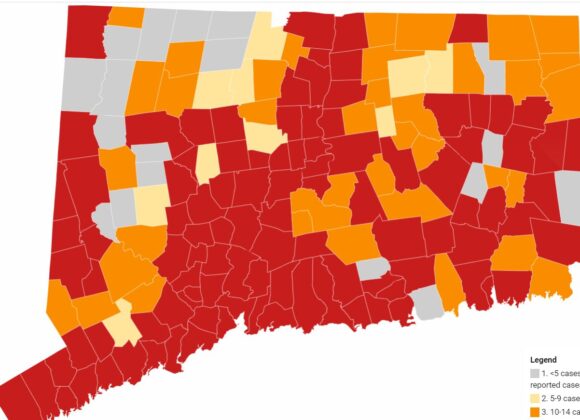
This map shows the average daily rate of new cases of COVID-19 by town during the past two weeks. The Town of Old Lyme has moved into the {lowest) Gray Zone while Lyme remains in the (highest) Red Zone. (Only cases among persons living in community settings are included in this map; the map does not include cases among people who reside in nursing home, assisted living, or correctional facilities.)

LYME/OLD LYME — The Daily Data Report for Connecticut issued Thursday, March 4, by the Connecticut Department of Public Health(CT DPH) for data as at 8:30 p.m., Wednesday, March 3, shows that cumulative cases (confirmed and probable) since the pandemic began increased by one in Old Lyme to 282 and by one in Lyme to 89 compared with the previous day’s numbers.

The next CT DPH Daily Data Report for Connecticut will be issued in the afternoon of Friday, March 5.

Old Lyme Now in Gray (Lowest) Zone for Two-Week New Case Rate, Lyme Remains in (Highest) Red Zone

The report issued Thursday, March 4, by the Connecticut Department of Public Health (CT DPH) for the average daily rate of new cases of COVID-19 by town during the past two weeks contains good news for Old Lyme … but not Lyme.

This report is issued daily, but only updated weekly on Thursdays. The most recent report was updated Thursday, March 4: the next updated report will be issued in the afternoon of Thursday, March 11.

It shows that Old Lyme has moved from the (second lowest) Yellow Zone down into the (lowest) Gray Zone reflecting an even lower case rate than the previous week.

Unfortunately, Lyme remains in the ‘Red Zone’ — the category with the highest rate of new cases.

(Four zones are specified by the CT DPH — see details below)

Overall, the report contains good news for the whole state with the number of towns in each Zone increasing this week in every case (the previous week’s figures shown in parentheses):

  • 18 (10) towns are now in the (lowest case rate) Gray Zone
  • 10 (7) are in the (lowest but one) Yellow Zone
  • 36 (28) are in the (second highest case rate) Orange Zone.

All the remaining towns are in the Red Zone, but this represents a dramatic improvement from the map published in November when every town in the state was in the Red Zone.

This report shows that Old Lyme now joins 17 other towns — Barkamsted, Bethlehem, Bridgewater, Canaan, Chester, Colebrook, Cornwall, Eastford, Franklin, Hartland, Morris, Norfolk, Roxbury, Scotland, Sharon, Voluntown and Warren — in the Gray (lowest rate)  Zone.

The Yellow (second lowest rate) Zone includes Bolton, Canton, Easton, Farmington, Granby, New Hartford, Plymouth, Tolland, Woodbury and Willington.

  • The gray category is defined as when the Average Daily Rate of COVID-19 Cases Among Persons Living in Community Settings per 100,000 Population By Town is less than five or less than five reported cases.
  • The yellow category is defined as when the Average Daily Rate of COVID-19 Cases Among Persons Living in Community Settings per 100,000 Population By Town is between five and nine reported cases.
  • The orange category is defined as when the Average Daily Rate of COVID-19 Cases Among Persons Living in Community Settings per 100,000 Population By Town is between 10 and 14.
  • The red category is defined as when the Average Daily Rate of COVID-19 Cases Among Persons Living in Community Settings per 100,000 Population By Town exceeds 15.

In all cases, this rate does not include cases or tests among residents of nursing home, assisted living, or correctional facilities.

More Detail on Two-Week Case Rates

On Thursday, March 4, Ledge Light Health District (LLHD) also issued their latest weekly report of COVID data for the municipalities within their District. Ledge Light Director of Health Stephen Mansfield prefaces the report with the comment, “We are encouraged to see relatively steady numbers within our jurisdiction.’

He stresses, however, “Although we are making great strides with our COVID vaccination program, it is still imperative that we remain diligent in our mitigation strategies.”

The latest two-week case rates announced Thursday, March 4, for the period 2/14 to 2/27 per 100,000 population (compared with the previous two-week case rate for 2/07 to 2/20) have fallen in both Old Lyme and Lyme.

The two-week case rates are as follows:

  • Old Lyme from 6.8 to 4.8
  • Lyme from 24.4 to 15.3

The same report shows that the case numbers in Week 1 and Week 2 respectively and recorded for the period 2/14 to 2/27  (compared with the previous two-week case rate for 2/07 to 2/20 shown in parentheses) are as follows:

  • Lyme had(5) cases in Week 1 and 3 (3) in Week 2
  • Old Lyme had 2 (4) cases in Week 1 and 3 (3) in Week 2

This data was updated March 4, 2021. The next Ledge Light Weekly Data Report for its District will be issued in the afternoon of Thursday, March 11.

Lyme – Cumulative Cases Up One

Lyme has a cumulative total (since the outbreak began) of 82 confirmed cases and 7 probable cases, making a TOTAL of 89 cases.

This represents an INCREASE of ONE in the cumulative number of confirmed cases and NO CHANGE in the number of probable cases compared with those reported Wednesday, March 3.

The total number of Lyme residents tested is 1,272, an increase of seven over Wednesday’s number of 1,265.

Old Lyme – Cumulative Cases Up One

Old Lyme has a cumulative total (since the outbreak began) of 276 confirmed COVID-19 cases and SIX probable casesmaking a TOTAL of 282 cases.

This represents an INCREASE of ONE in the cumulative number of confirmed cases and NO CHANGE in the number of probable cases compared with those reported Wednesday, March 3.

The total number of Old Lyme residents tested is 4,738, up 10 from the previous day’s number of 4,728.

Three Fatalities in Old Lyme Since Pandemic Began, None in Lyme

According to the report mentioned above, there have now been THREE fatalities in Old Lyme. Asked Tuesday, Feb. 9, for details of this third fatality, Ledge Light Health Department Director of Health Stephen Mansfield responded, “We have not been notified of any recent deaths in Old Lyme. Keep in mind that that report is compiled by the Connecticut Department of Public Health; deaths are not reportable to local health districts.”

He added, “I can’t speak for their data sources.”

The two fatalities from Old Lyme previously reported in 2020 were a 61-year-old female and an 82-year-old male.

No fatalities have been reported in Lyme.

Connecticut Hospital Occupancy

At the request of several readers, we are adding a new report today showing the respective rates of hospital occupancy at local hospitals. The data for this report is obtained from the Connecticut Hospital Occupancy Report published weekly by the CT DPH and extracted from the United States Department of Health and Human Services (HHS) facility-level data for hospital utilization aggregated on a weekly basis (Friday to Thursday).

[table id=10 /]

Editor’s Note: The state issues a COVID-19 metric report daily around 4 p.m. Monday through Friday, which includes current data up to the previous evening. In light of the serious rise in Coronavirus cases, we publish a new weekday update reporting confirmed and probable COVID-19 cases in Lyme and Old Lyme. 

Basketball Update: Playing N. Branford, Girls Continue Winning Streak, Boys Victorious in Gritty Game

OLD LYME/NORTH BRANFORD — The boys and girls teams both defeated their North Branford opponents last night, the girls playing away while the boys, for whom it was senior night, were at home.

In Coach Kaczor’s words, the boys, “… hung on to beat a scrappy North Branford team 58-51.”

Read a full report of the boy’s game published in The Day at this link.

The girls faced a tough challenge down at North Branford but ultimately secured their seventh win a row and advanced to a 7-1 record. The final score was 51-44.

Emily DeRoehn had 16 points and 10 rebounds while Sam Gray notched 12 points and Emma McCulloch seven points and 10 rebounds.

After the game, coach Don Bugbee told LymeLine, “This was a very hard fought battle from start to finish. The girls earned this win for sure. Congrats to them all!”

The Junior Varsity girls also defeated the Thunderbirds winning 46-36. Sophomores Alexis Fenton and Hayley Cann had respectively 16 and 12 points. Freshman Ava Roth added nine.

The girls face Valley Regional Monday, March 8, at Old Lyme on their Senior Night. Tip-off for Varsity is 5:30 p.m. and JV at 4 p.m.

March 2 COVID-19 Update: Cumulative Cases in Lyme up One to 88, Old Lyme Holds at 281

Photo by CDC on Unsplash

LYME/OLD LYME — (3/2 Update: Lyme total corrected in title) The Daily Data Report for Connecticut issued Tuesday, March 2, by the Connecticut Department of Public Health(CT DPH) for data as at 8:30 p.m., Monday, March 1, shows that cumulative cases (confirmed and probable) since the pandemic began increased by ONE in Lyme to 88 but held steady in Old Lyme at 281.

The next CT DPH Daily Data Report for Connecticut will be issued in the afternoon of Wednesday, March 3.

Lyme – Cumulative Cases Up One

Lyme now has a cumulative total (since the outbreak began) of 81 confirmed cases and 7 probable cases, making a TOTAL of 88 cases.

This represents an INCREASE of 1 in the cumulative number of confirmed cases and NO CHANGE in the number of probable cases over those reported Monday, March 1.

The total number of Lyme residents tested is 1,264, an increase of two over Monday’s number.

Old Lyme – No Change in Cumulative Cases 

Old Lyme now has a cumulative total (since the outbreak began) of 275 confirmed COVID-19 cases and SIX probable casesmaking a TOTAL of 281 cases.

This represents NO CHANGE in the cumulative number of confirmed or probable cases compared with those reported Monday, March 1.

The total number of Old Lyme residents tested is 4,724, up 6 from the previous day’s number.

Old Lyme Now in Yellow (Second Lowest) Zone for Two-Week New Case Rate, Lyme Remains in (Highest) Red Zone

The report issued Tuesday, March 2, by the Connecticut Department of Public Health (CT DPH) for the average daily rate of new cases of COVID-19 by town during the past two weeks contains good news for Old Lyme … but not Lyme. This report is issued daily, but only updated weekly on Thursdays. The current report was updated Thursday, Feb. 25: the next updated report will be issued in the afternoon of Thursday, March 4.

It shows that Old Lyme has moved from the (second highest) Orange Zone down into the (lowest but one) Yellow Zone reflecting an even lower case rate than the previous week. Unfortunately, Lyme remains in the ‘Red Zone’ — the category with the highest rate of new cases. (Four zones are specified by the CT DPH — see details below)

Overall, the report contains more good news for the whole state with the following data for this week (the previous week’s figures shown in parentheses):

  • 15 (10) towns are now in the (lowest case rate) Gray Zone
  • 7 (4) are in the (lowest but one) Yellow Zone
  • 28 (16) are in the (second highest case rate) Orange Zone.

All the remaining towns are in the Red Zone. This is, however, a dramatic improvement from the map we published back in November when every town in the state was in the Red Zone.

This report shows that Old Lyme now joins six other towns — Middlefield, Waterbury, Burlington, Bolton, Tolland and Granby — in the Yellow (second lowest rate)  Zone.

The Gray (lowest rate) Zone includes Bridgewater, Canaan, Cornwall, Goshen, New Hartford, Norfolk, Scotland, Hartland, Barkamsted, Eastford, Franklin, Lisbon, Pomfret, Roxbury,  and Warren.

  • The gray category is defined as when the Average Daily Rate of COVID-19 Cases Among Persons Living in Community Settings per 100,000 Population By Town is less than five or less than five reported cases.
  • The yellow category is defined as when the Average Daily Rate of COVID-19 Cases Among Persons Living in Community Settings per 100,000 Population By Town is between five and nine reported cases.
  • The orange category is defined as when the Average Daily Rate of COVID-19 Cases Among Persons Living in Community Settings per 100,000 Population By Town is between 10 and 14.
  • The red category is defined as when the Average Daily Rate of COVID-19 Cases Among Persons Living in Community Settings per 100,000 Population By Town exceeds 15.

In all cases, this rate does not include cases or tests among residents of nursing home, assisted living, or correctional facilities.

Three Fatalities in Old Lyme Since Pandemic Began, None in Lyme

According to the report mentioned above, there have now been THREE fatalities in Old Lyme. Asked Tuesday, Feb. 9, for details of this third fatality, Ledge Light Health Department Director of Health Stephen Mansfield responded, “We have not been notified of any recent deaths in Old Lyme. Keep in mind that that report is compiled by the Connecticut Department of Public Health; deaths are not reportable to local health districts.”

He added, “I can’t speak for their data sources.”

The two fatalities from Old Lyme previously reported in 2020 were a 61-year-old female and an 82-year-old male.

No fatalities have been reported in Lyme.

More Detail on Two-Week Case Rates

On Thursday, Feb. 25, Ledge Light Health District (LLHD) also issued their latest weekly report of COVID data for the municipalities within their District. Ledge Light Director of Health Stephen Mansfield prefaces the report with the comment, “We are encouraged to see a moderate decrease in cases for the 6th consecutive reporting period, and are hopeful that this trend will continue.”

The latest two-week case rate announced Thursday, Feb. 25, for the period 2/7 to 2/20 per 100,000 population (compared with the previous two-week case rate for 1/31 to 2/13) has fallen in Old Lyme but increased in Lyme.

The two-week case rates are as follows:

  • Old Lyme from 11.6 to 6.8
  • Lyme from 21.4 to 24.4

The same report shows that the number of cases in Week 1 and Week 2 recorded for the period 2/7 to 2/20  (compared with the previous two-week case rate for 1/31 to 2/13 shown in parentheses) is as follows:

  • Lyme had 5 (2) cases in Week 1 and 3 (5) in Week 2
  • Old Lyme had 4 (9) cases in Week 1 and 3 (7) in Week 2

This data was updated Feb. 25, 2021. The next Ledge Light Weekly Data Report for their District will be issued in the afternoon of Thursday, March 4.

Connecticut Hospital Occupancy

At the request of several readers, we are adding a new report today showing the respective rates of hospital occupancy at local hospitals. The data for this report is obtained from the Connecticut Hospital Occupancy Report published weekly by the CT DPH and extracted from the United States Department of Health and Human Services (HHS) facility-level data for hospital utilization aggregated on a weekly basis (Friday to Thursday).

[table id=10 /]

Editor’s Note: The state issues a COVID-19 metric report daily around 4 p.m. Monday through Friday, which includes current data up to the previous evening. In light of the serious rise in Coronavirus cases, we publish a new weekday update reporting confirmed and probable COVID-19 cases in Lyme and Old Lyme.