A Chilling Adventure: Hadlyme’s Theobald Describes His Extraordinary Journey Through the Northwest Passage

The ‘Bagan’ sails into the Northwest Passage.

LYME — The Northwest Passage—the sea route connecting the Atlantic to the Pacific— is widely considered the ultimate uncharted territory. Sailing from Newport, R.I., through the infamous Passage and around Alaska to Seattle, is an 8,500-mile trek filled with constant danger from ice, polar bears, and severe weather.

Sprague Theobald

Hadlyme resident Sprague Theobald, an award-winning documentary filmmaker and expert sailor, has completed this extraordinary journey.

In so doing, he and his crew became only the 24th non-military craft to have navigated the Passage since Roald Amundsen completed the first successful crossing of the fabled Northwest Passage in 1906.

Hear all about Theobald’s extraordinary journey and its harrowing story of survival, adventure, and, finally, redemption in a Zoom presentation hosted by the Friends of Lyme Library titled, The Other Side of the Ice,  tomorrow, (Saturday, March 20) at 3 p.m. Theobald himself will present the program.  

Email programreg@lymepl.org as soon as possible to register for this program and obtain the Zoom link.

Asked how he ever came up with the idea of undertaking that journey,  Theobald replied, “As far back as I can remember I’ve always been fascinated by the idea of a shortcut through the Arctic, but yet, nobody could find it. How could a place exist that nobody knows about but yet they go searching for it?”

Standing on the bow of the ‘Bagan’ as it sailed through the bitterly cold, unforgiving Northwest Passage.

Theobald continued, “As I grew older and started to read the incredible tragic history of those who went to search for the Passage I became absolutely intrigued. I can’t say that it was always on my mind but I spent many, many years on boats (I’ve about 40,000 off-shore miles) and the thought of attempting to transit the Passage was always in the back of my mind.”

He said triumphantly, “Finally, all the forces came together!” noting that it took about two and a half years, “… from my openly musing about the idea to finally leaving Newport,” aboard the Bagan.

In the 1850s, the Franklin Expedition left England to find the Northwest Passage. Beechy Island was one of their last known stopping areas. The expedition was frozen in the ice for two years. This grave marker cites where one of the crew was buried.

What followed was five months on the Bagan of unrelenting cold, hungry polar bears, and a haunting landscape littered with sobering artifacts from the tragic Franklin Expedition of 1845. Theobald will explain in his presentation the innumerable ways in which the incredibly challenging trip has impacted his life since he returned to land.

Asked which of those experiences had affected him the most, Theobald responded, “As you can imagine there were many experiences which truly changed my life but I think the most powerful one was the few days that we were trapped in the ice and slowly being driven ashore by a powerful underwater current.”

He continued, “Whether it was exhaustion or fatalism, I truly understood the feeling of simply letting go and making the best of it. It was simply survival. There was absolutely nothing I could do to keep us from being pushed into the rock-face cliffs. Try as I may, I couldn’t stop Mother Nature.”

As he worked to define that specific emotion in his mind, Theobald said, “The freedom of letting go allowed me to think through the process as to what I could possibly do in the various scenarios that faced us. Luckily the very force that was hinting at our demise also rescued us! The underwater current that was pushing us ashore must’ve had a back eddy in it, for once we came within a quarter of a mile from the rocks, we very slowly started going backwards in an arc.”

He concluded, “To this day, I am able to utilize that same great feeling of knowing when and ow to simply let go and to be able to stand back objectively and assess a situation rather than be caught up in it.”

March 18 COVID-19 Update: Old Lyme Moves Up Into Orange (Second Highest) Two-Week Case Rate Zone; Lyme Drops to Gray (Lowest) Zone

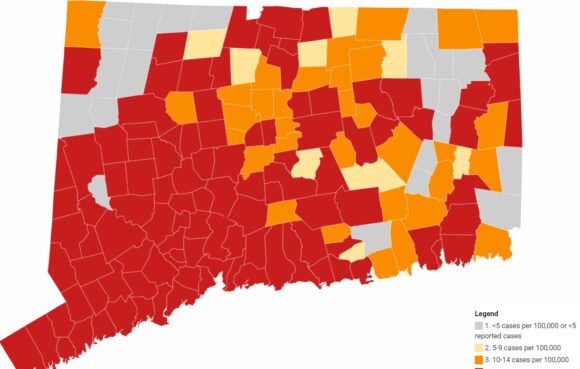
This map, updated March 18, shows the average daily rate of new cases of COVID-19 by town during the past two weeks. The Town of Old Lyme has moved up into the (second from highest) Orange Zone (it was in the second from lowest Yellow Zone last week), while Lyme drops to the (lowest) Gray Zone. (Only cases among persons living in community settings are included in this map; the map does not include cases among people who reside in nursing home, assisted living, or correctional facilities.)

LYME/OLD LYME — The report issued Thursday, March 18, by the Connecticut Department of Public Health (CT DPH) for the average daily rate of new cases of COVID-19 by town during the past two weeks contains good news for Lyme but bad news for Old Lyme.

It shows that Old Lyme has moved back into the Orange (second highest) Zone for two-week new case rates, but Lyme has fallen into the Gray (lowest) Zone.

Last week, Old Lyme was in the (second lowest) Yellow Zone and so this change reflects an increased two-week case rate over the previous week. In contrast, Lyme was in the ‘Red Zone’ — the category with the highest rate of new cases — last week and has now dropped to the lowest. (Four zones are specified by the CT DPH — see details below)

Overall, the report contains mixed news for the whole state with the number of towns in the Gray and Yellow Zone decreasing this week (the previous week’s figures are shown in parentheses), but the Orange Zone shows an increase:

  • 22 (25) towns are now in the (lowest case rate) Gray Zone
  • 9 (11) are in the (lowest but one) Yellow Zone
  • 33 (30) are in the (second highest case rate) Orange Zone.

All the remaining towns are in the Red Zone, but this still represents an obvious improvement from the map published in November when every town in the state was in the Red Zone. The numbers are concerning however, in that the trend appears to be that cases are not continuing to decrease at this point.

Lyme joins 21 other towns in the Gray (lowest rate)  Zone including Ashford, Bozrah, Bridgewater, Canaan, Chaplin, Colebrook, Cornwall, Eastford, Franklin, Goshen, Hampton, Hartland, Kent, New Canaan, North Stonington, Norfolk, Pomfret, Scotland, Union, Voluntown, and Warren.

The Yellow (second lowest rate) Zone includes Barkamsted, Colchester, East Windsor, Essex, Lisbon, Portland, Simsbury, Somers and Willington.

  • The gray category is defined as when the Average Daily Rate of COVID-19 Cases Among Persons Living in Community Settings per 100,000 Population By Town is less than five or less than five reported cases.
  • The yellow category is defined as when the Average Daily Rate of COVID-19 Cases Among Persons Living in Community Settings per 100,000 Population By Town is between five and nine reported cases.
  • The orange category is defined as when the Average Daily Rate of COVID-19 Cases Among Persons Living in Community Settings per 100,000 Population By Town is between 10 and 14.
  • The red category is defined as when the Average Daily Rate of COVID-19 Cases Among Persons Living in Community Settings per 100,000 Population By Town exceeds 15.

In all cases, this rate does not include cases or tests among residents of nursing home, assisted living, or correctional facilities.

This report is issued daily, but only updated weekly on Thursdays. The most recent report was updated yesterday, Thursday, March 11; the next updated report will be issued in the afternoon of Thursday, March 25.

More Detail on Two-Week Case Rates

LLHD Director of Health Stephen Mansfield

On Thursday, March 18, Ledge Light Health District (LLHD) also issued their latest weekly report of COVID data for the municipalities within their District. Ledge Light Director of Health Stephen Mansfield prefaces the report with the comment, “We continue to see relatively steady case numbers within our jurisdiction.”

He stresses, however, “Although we are making great strides with our COVID vaccination program, it is still imperative that we remain diligent in our mitigation strategies.”

The latest two-week case rates announced Thursday, March 18, for the period 2/28 to 3/13 per 100,000 population (compared with the previous two-week case rate for 2/21 to 3/06) have increased in Old Lyme and decreased in Lyme.

The two-week case rates are as follows:

  • Old Lyme from 6.8 to 13.6
  • Lyme from 18.3 to 9.2

The same report shows that the case numbers in Week 1 and Week 2 respectively and recorded for the period 2/28 to 3/13  (compared with the previous two-week case rate for 2/21 to 3/06 shown in parentheses) are as follows:

  • Lyme had(3) cases in Week 1 and(3) in Week 2
  • Old Lyme had (2) cases in Week 1 and (5) in Week 2

This data was updated March 18, 2021. The next Ledge Light Weekly Data Report for its District will be issued in the afternoon of Thursday, March 25.

Old Lyme – Cumulative Cases Down One

The Daily Data Report for Connecticut issued Thursday, March 18, by the Connecticut Department of Public Health (CT-DPH) for data as at 8:30 p.m. Wednesday, March 17, shows that Old Lyme has a cumulative total (since the outbreak began) of 290 confirmed COVID-19 cases and SEVEN probable casesmaking a TOTAL of 297 cases.

This represents NO CHANGE in the cumulative number of confirmed or probable cases compared with those reported Wednesday, March 17.

The total number of Old Lyme residents tested is 4,839, an increase of four over that reported Wednesday.

Lyme – No Change in Cumulative Cases

Lyme has a cumulative total (since the outbreak began) of 84 confirmed cases and 7 probable cases, making a TOTAL of 91 cases.

This represents NO CHANGE in the cumulative number of confirmed or  probable cases compared with those reported Wednesday, March 18. This represents the ninth day in succession with no increase in cases.

The total number of Lyme residents tested is 1,307, an increase of three over Wednesday’s number of 1,304.

Vaccination Rates

At the request of several readers, we have started a new section today reflecting the status of community vaccination rates in Lyme and Old Lyme. The data is taken from the COVID-19 Vaccinations by Town report published by CT-DPH, which is published roughly weekly.

Old Lyme is ahead of Lyme in terms of the percentage of its total population that have received a first dose, with 42.02 percent vaccinated compared with 34.59 percent in Lyme. The percentages for both towns for the age segments 65-74 and 75+ are very encouraging with Old Lyme now having 100.38 percent of seniors 75 and above having received their first dose and 75.18 percent of the same age segment having received it in Lyme. Editor’s Note: We are skeptical of these figures for Lyme since they show the numbers vaccinated decreasing compared with last week. We are investigating further.

The detailed data below is the most recent and was updated March 15.

Old Lyme
Total population:  7,306
Estimated population age 65-74:  1,067
Estimated population age 75 and above:  794

Total population 1st dose administered: 3070 (2626)
1st dose administered as % of total population:  42.02% (35.94%) 

1st dose administered age 65-74:  1,027 (945)
1st dose administered as % of age 65-74 population:  96.25% (88.57%)

1st dose administered age 75 and above:  797 (764)
1st dose administered as % of age 75 and above population:  100.38% (96.22%)

Lyme
Total population:  2,316
Estimated population age 65-74:  372
Estimated population age 75 and above:  274

Total population 1st dose administered: 801 (767)
1st dose administered as % of total population:  34.59% (33.12%)

1st dose administered age 65-74: 269 (281) 
1st dose administered as % of age 65-74 population: 72.31% (75.54%)

1st dose administered age 75 and above: 206 (229)
1st dose administered as % of age 75 and above population: 75.18% (83.58%)

Three Fatalities in Old Lyme Since Pandemic Began, None in Lyme

According to the report mentioned above, there have now been THREE fatalities in Old Lyme. Asked Tuesday, Feb. 9, for details of this third fatality, Ledge Light Health Department Director of Health Stephen Mansfield responded, “We have not been notified of any recent deaths in Old Lyme. Keep in mind that that report is compiled by the Connecticut Department of Public Health; deaths are not reportable to local health districts.”

He added, “I can’t speak for their data sources.”

The two fatalities from Old Lyme previously reported in 2020 were a 61-year-old female and an 82-year-old male.

No fatalities have been reported in Lyme.

Connecticut Hospital Occupancy

At the request of several readers, we are adding a new report today showing the respective rates of hospital occupancy at local hospitals. The data for this report is obtained from the Connecticut Hospital Occupancy Report published weekly by the CT DPH and extracted from the United States Department of Health and Human Services (HHS) facility-level data for hospital utilization aggregated on a weekly basis (Friday to Thursday).

[table id=10 /]

Editor’s Note: The state issues a COVID-19 metric report daily around 4 p.m. Monday through Friday, which includes current data up to the previous evening. In light of the ongoing rise in Coronavirus cases, we publish a new weekday update reporting confirmed and probable COVID-19 cases in Lyme and Old Lyme. 

March 16 COVID-19 Update: Old Lyme Cumulative Cases Climb Four to 298; Lyme’s Still at 91 After a Week

Transmission electron microscopic image of an isolate from the first U.S. case of COVID-19, formerly known as 2019-nCoV. Photo courtesy of the CDC.

LYME/OLD LYME — The Daily Data Report for Connecticut issued Tuesday, March 16, by the Connecticut Department of Public Health(CT-DPH) for data as at 8:30 p.m., Monday, March 15, shows that cumulative cases (confirmed and probable) since the pandemic began increased by four in Old Lyme to 298 and held steady in Lyme at 91 when compared with the numbers reported Monday, March 15.

This means Lyme has reported the same number of 91 cumulative cases for a full week now.

It should be noted that Monday reports always include data for the previous three days because reports are not issued on Saturdays or Sundays. The reporting period is 24 hours for all the other days reports are issued (Tuesday through Friday.)

The next CT DPH Daily Data Report for Connecticut will be issued in the afternoon of Wednesday, March 17.

Old Lyme – Cumulative Cases Up Four

Old Lyme has a cumulative total (since the outbreak began) of 291 confirmed COVID-19 cases and SEVEN probable casesmaking a TOTAL of 298 cases.

This represents an INCREASE of FOUR in the cumulative number of confirmed cases and NO CHANGE in the number of probable cases compared with those reported Monday, March 15.

The total number of Old Lyme residents tested is 4,835, up 10 from the Monday’s number of 4,825.

Lyme – No Change in Cumulative Cases

Lyme has a cumulative total (since the outbreak began) of 84 confirmed cases and 7 probable cases, making a TOTAL of 91 cases.

This represents NO CHANGE in the cumulative number of confirmed or  probable cases compared with those reported Monday, March 15. This number of 91 cases was first reported Tuesday, March 9, and has not changed since.

The total number of Lyme residents tested is 1,302, an increase of one over Thursday’s number of 1,301.

Old Lyme Moves Back into Yellow (Lowest but One) Zone for Two-Week New Case Rate, Lyme Remains in (Highest) Red Zone

The report issued Friday, March 12, by the Connecticut Department of Public Health (CT DPH) for the average daily rate of new cases of COVID-19 by town during the past two weeks contains disappointing news for both Lyme and Old Lyme.

This report is issued daily, but only updated weekly on Thursdays. The most recent report was updated Thursday, March 11; the next updated report will be issued in the afternoon of Thursday, March 18.

It shows that Old Lyme has moved back into the (second lowest) Yellow Zone from the (lowest) Gray Zone reflecting an increased case two-week case rate  over the previous week.

Lyme remains in the ‘Red Zone’ — the category with the highest rate of new cases.

(Four zones are specified by the CT DPH — see details below)

Overall, the report contains fairly good news for the whole state with the number of towns in the Gray and Yellow Zone increasing this week (the previous week’s figures shown in parentheses) but the Orange Zone shows an increase:

  • 25 (18) towns are now in the (lowest case rate) Gray Zone
  • 11 (10) are in the (lowest but one) Yellow Zone
  • 30 (36) are in the (second highest case rate) Orange Zone.

All the remaining towns are in the Red Zone, but this still represents a dramatic improvement from the map published in November when every town in the state was in the Red Zone.

This report shows that Old Lyme now joins 10 other towns — Bolton, Columbia, Farmington, Granby, Marlborough, Morris, New Hartford, Portland, Simsbury, South Windsor, and Willington — in the Yellow (second lowest rate) Zone.

The Gray (lowest rate)  Zone includes Andover, Ashford, Barkamsted, Bethany, Bethlehem, Bridgewater, Canaan, Chaplin, Colebrook, Cornwall, Deep River, Eastford, Franklin, Goshen, Hartland, Morris, North Canaan, Norfolk, Roxbury, Salem, Sprague, Scotland, Sharon, Voluntown, Warren, and Washington,

  • The gray category is defined as when the Average Daily Rate of COVID-19 Cases Among Persons Living in Community Settings per 100,000 Population By Town is less than five or less than five reported cases.
  • The yellow category is defined as when the Average Daily Rate of COVID-19 Cases Among Persons Living in Community Settings per 100,000 Population By Town is between five and nine reported cases.
  • The orange category is defined as when the Average Daily Rate of COVID-19 Cases Among Persons Living in Community Settings per 100,000 Population By Town is between 10 and 14.
  • The red category is defined as when the Average Daily Rate of COVID-19 Cases Among Persons Living in Community Settings per 100,000 Population By Town exceeds 15.

In all cases, this rate does not include cases or tests among residents of nursing home, assisted living, or correctional facilities.

More Detail on Two-Week Case Rates

LLHD Director of Health Stephen Mansfield

On Thursday, March 11, Ledge Light Health District (LLHD) issued their latest weekly report of COVID data for the municipalities within their District. Ledge Light Director of Health Stephen Mansfield prefaces the report with the comment, “We are encouraged to see relatively steady numbers within our jurisdiction.”

He stresses, however, “Although we are making great strides with our COVID vaccination program, it is still imperative that we remain diligent in our mitigation strategies.”

The latest two-week case rates announced Thursday, March 11, for the period 2/21 to 3/06 per 100,000 population (compared with the previous two-week case rate for 2/07 to 2/20) have increased in both Old Lyme and Lyme.

The two-week case rates are as follows:

  • Old Lyme from 4.8 to 6.8
  • Lyme from 15.3 to 18.3

The same report shows that the case numbers in Week 1 and Week 2 respectively and recorded for the period 2/14 to 2/27  (compared with the previous two-week case rate for 2/07 to 2/20 shown in parentheses) are as follows:

  • Lyme had(2) cases in Week 1 and 3 (3) in Week 2
  • Old Lyme had 2 (2) cases in Week 1 and 5 (3) in Week 2

This data was updated March 11, 2021. The next Ledge Light Weekly Data Report for its District will be issued in the afternoon of Thursday, March 18.

Vaccination Rates

At the request of several readers, we have started a new section reflecting the status of community vaccination rates in Lyme and Old Lyme. The data is taken from the COVID-19 Vaccinations by Town report published by CT-DPH, which is published roughly weekly.

Old Lyme is marginally ahead of Lyme in terms of the percentage of its total population that have received a first dose, with 35.94 percent vaccinated compared with 33.12 percent in Lyme. The percentages for both towns for the age segments 65-74 and 75+ are very encouraging with Old Lyme now having 96.22 percent of seniors 75 and above having received their first dose and 83.58 percent of the same age segment having received it in Lyme.

The detailed data below is the most recent and was updated March 8.

Old Lyme
Total population:  7,306
Estimated population age 65-74:  1,067
Estimated population age 75 and above:  794

Total population 1st dose administered:  2626 (2,115)
1st dose administered as % of total population:  35.94% (28.95%)

1st dose administered age 65-74:  945 (835)
1st dose administered as % of age 65-74 population:  88.57% (78%)

1st dose administered age 75 and above:  764 (730)
1st dose administered as % of age 75 and above population:  96.22% (92%)

Lyme
Total population:  2,316
Estimated population age 65-74:  372
Estimated population age 75 and above:  274

Total population 1st dose administered:  767 (605)
1st dose administered as % of total population:  33.12% (26.12%)

1st dose administered age 65-74: 281 (244)
1st dose administered as % of age 65-74 population: 75.54% (66%)

1st dose administered age 75 and above: 229 (222)
1st dose administered as % of age 75 and above population: 83.58% (81%)

Three Fatalities in Old Lyme Since Pandemic Began, None in Lyme

According to the report mentioned above, there have now been THREE fatalities in Old Lyme. Asked Tuesday, Feb. 9, for details of this third fatality, Ledge Light Health Department Director of Health Stephen Mansfield responded, “We have not been notified of any recent deaths in Old Lyme. Keep in mind that that report is compiled by the Connecticut Department of Public Health; deaths are not reportable to local health districts.”

He added, “I can’t speak for their data sources.”

The two fatalities from Old Lyme previously reported in 2020 were a 61-year-old female and an 82-year-old male.

No fatalities have been reported in Lyme.

Connecticut Hospital Occupancy

At the request of several readers, we have added a new report today showing the respective rates of hospital occupancy at local hospitals. The data for this report is obtained from the Connecticut Hospital Occupancy Report published weekly by the CT DPH and extracted from the United States Department of Health and Human Services (HHS) facility-level data for hospital utilization aggregated on a weekly basis (Friday to Thursday).

[table id=10 /]

Editor’s Note: The state issues a COVID-19 metric report daily around 4 p.m. Monday through Friday, which includes current data up to the previous evening. In light of the ongoing rise in Coronavirus cases, we publish a new weekday update reporting confirmed and probable COVID-19 cases in Lyme and Old Lyme. 

March 15 COVID-19 Update: Old Lyme Cumulative Cases Jump Five to 294, Lyme’s Hold at 91

LYME/OLD LYME — The Daily Data Report for Connecticut issued Monday, March 15, by the Connecticut Department of Public Health(CT-DPH) for data as at 8:30 p.m., Sunday, March 14, shows that cumulative cases (confirmed and probable) since the pandemic began increased by five in Old Lyme to 294 and held steady in Lyme at 91 when compared with the numbers reported Friday, March 12.

It should be noted that Monday reports always include data for the previous three days because reports are not issued on Saturdays or Sundays. The reporting period is 24 hours for all the other days reports are issued (Tuesday through Friday.)

The next CT DPH Daily Data Report for Connecticut will be issued in the afternoon of Tuesday, March 16.

Old Lyme – Cumulative Cases Up Five

Old Lyme has a cumulative total (since the outbreak began) of 287 confirmed COVID-19 cases and SEVEN probable casesmaking a TOTAL of 294 cases.

This represents an INCREASE of FIVE in the cumulative number of confirmed cases and NO CHANGE in the number of probable cases compared with those reported Friday, March 12.

The total number of Old Lyme residents tested is 4,825, up 24 from the Thursday’s number of 4,801.

Lyme – No Change in Cumulative Cases

Lyme has a cumulative total (since the outbreak began) of 84 confirmed cases and 7 probable cases, making a TOTAL of 91 cases.

This represents NO CHANGE in the cumulative number of confirmed or  probable cases compared with those reported Friday, March 12.

The total number of Lyme residents tested is 1,301, an increase of five over Thursday’s number of 1,293.

Old Lyme Moves Back into Yellow (Lowest but One) Zone for Two-Week New Case Rate, Lyme Remains in (Highest) Red Zone

The report issued Friday, March 12, by the Connecticut Department of Public Health (CT DPH) for the average daily rate of new cases of COVID-19 by town during the past two weeks contains disappointing news for both Lyme and Old Lyme.

This report is issued daily, but only updated weekly on Thursdays. The most recent report was updated Thursday, March 11; the next updated report will be issued in the afternoon of Thursday, March 18.

It shows that Old Lyme has moved back into the (second lowest) Yellow Zone from the (lowest) Gray Zone reflecting an increased case two-week case rate  over the previous week.

Lyme remains in the ‘Red Zone’ — the category with the highest rate of new cases.

(Four zones are specified by the CT DPH — see details below)

Overall, the report contains fairly good news for the whole state with the number of towns in the Gray and Yellow Zone increasing this week (the previous week’s figures shown in parentheses) but the Orange Zone shows an increase:

  • 25 (18) towns are now in the (lowest case rate) Gray Zone
  • 11 (10) are in the (lowest but one) Yellow Zone
  • 30 (36) are in the (second highest case rate) Orange Zone.

All the remaining towns are in the Red Zone, but this still represents a dramatic improvement from the map published in November when every town in the state was in the Red Zone.

This report shows that Old Lyme now joins 10 other towns — Bolton, Columbia, Farmington, Granby, Marlborough, Morris, New Hartford, Portland, Simsbury, South Windsor, and Willington — in the Yellow (second lowest rate) Zone.

The Gray (lowest rate)  Zone includes Andover, Ashford, Barkamsted, Bethany, Bethlehem, Bridgewater, Canaan, Chaplin, Colebrook, Cornwall, Deep River, Eastford, Franklin, Goshen, Hartland, Morris, North Canaan, Norfolk, Roxbury, Salem, Sprague, Scotland, Sharon, Voluntown, Warren, and Washington,

  • The gray category is defined as when the Average Daily Rate of COVID-19 Cases Among Persons Living in Community Settings per 100,000 Population By Town is less than five or less than five reported cases.
  • The yellow category is defined as when the Average Daily Rate of COVID-19 Cases Among Persons Living in Community Settings per 100,000 Population By Town is between five and nine reported cases.
  • The orange category is defined as when the Average Daily Rate of COVID-19 Cases Among Persons Living in Community Settings per 100,000 Population By Town is between 10 and 14.
  • The red category is defined as when the Average Daily Rate of COVID-19 Cases Among Persons Living in Community Settings per 100,000 Population By Town exceeds 15.

In all cases, this rate does not include cases or tests among residents of nursing home, assisted living, or correctional facilities.

More Detail on Two-Week Case Rates

LLHD Director of Health Stephen Mansfield

On Thursday, March 11, Ledge Light Health District (LLHD) issued their latest weekly report of COVID data for the municipalities within their District. Ledge Light Director of Health Stephen Mansfield prefaces the report with the comment, “We are encouraged to see relatively steady numbers within our jurisdiction.”

He stresses, however, “Although we are making great strides with our COVID vaccination program, it is still imperative that we remain diligent in our mitigation strategies.”

The latest two-week case rates announced Thursday, March 11, for the period 2/21 to 3/06 per 100,000 population (compared with the previous two-week case rate for 2/07 to 2/20) have increased in both Old Lyme and Lyme.

The two-week case rates are as follows:

  • Old Lyme from 4.8 to 6.8
  • Lyme from 15.3 to 18.3

The same report shows that the case numbers in Week 1 and Week 2 respectively and recorded for the period 2/14 to 2/27  (compared with the previous two-week case rate for 2/07 to 2/20 shown in parentheses) are as follows:

  • Lyme had(2) cases in Week 1 and 3 (3) in Week 2
  • Old Lyme had 2 (2) cases in Week 1 and 5 (3) in Week 2

This data was updated March 11, 2021. The next Ledge Light Weekly Data Report for its District will be issued in the afternoon of Thursday, March 18.

Vaccination Rates

At the request of several readers, we have started a new section reflecting the status of community vaccination rates in Lyme and Old Lyme. The data is taken from the COVID-19 Vaccinations by Town report published by CT-DPH, which is published roughly weekly.

Old Lyme is marginally ahead of Lyme in terms of the percentage of its total population that have received a first dose, with 35.94 percent vaccinated compared with 33.12 percent in Lyme. The percentages for both towns for the age segments 65-74 and 75+ are very encouraging with Old Lyme now having 96.22 percent of seniors 75 and above having received their first dose and 83.58 percent of the same age segment having received it in Lyme.

The detailed data below is the most recent and was updated March 8.

Old Lyme
Total population:  7,306
Estimated population age 65-74:  1,067
Estimated population age 75 and above:  794

Total population 1st dose administered:  2626 (2,115)
1st dose administered as % of total population:  35.94% (28.95%)

1st dose administered age 65-74:  945 (835)
1st dose administered as % of age 65-74 population:  88.57% (78%)

1st dose administered age 75 and above:  764 (730)
1st dose administered as % of age 75 and above population:  96.22% (92%)

Lyme
Total population:  2,316
Estimated population age 65-74:  372
Estimated population age 75 and above:  274

Total population 1st dose administered:  767 (605)
1st dose administered as % of total population:  33.12% (26.12%)

1st dose administered age 65-74: 281 (244)
1st dose administered as % of age 65-74 population: 75.54% (66%)

1st dose administered age 75 and above: 229 (222)
1st dose administered as % of age 75 and above population: 83.58% (81%)

Three Fatalities in Old Lyme Since Pandemic Began, None in Lyme

According to the report mentioned above, there have now been THREE fatalities in Old Lyme. Asked Tuesday, Feb. 9, for details of this third fatality, Ledge Light Health Department Director of Health Stephen Mansfield responded, “We have not been notified of any recent deaths in Old Lyme. Keep in mind that that report is compiled by the Connecticut Department of Public Health; deaths are not reportable to local health districts.”

He added, “I can’t speak for their data sources.”

The two fatalities from Old Lyme previously reported in 2020 were a 61-year-old female and an 82-year-old male.

No fatalities have been reported in Lyme.

Connecticut Hospital Occupancy

At the request of several readers, we have added a new report today showing the respective rates of hospital occupancy at local hospitals. The data for this report is obtained from the Connecticut Hospital Occupancy Report published weekly by the CT DPH and extracted from the United States Department of Health and Human Services (HHS) facility-level data for hospital utilization aggregated on a weekly basis (Friday to Thursday).

[table id=10 /]

Editor’s Note: The state issues a COVID-19 metric report daily around 4 p.m. Monday through Friday, which includes current data up to the previous evening. In light of the ongoing rise in Coronavirus cases, we publish a new weekday update reporting confirmed and probable COVID-19 cases in Lyme and Old Lyme. 

Initial Planning Meeting Scheduled for Lyme-Old Lyme Food Share Garden, All Welcome

Jim Ward tends the Community Garden at Clinton. He hopes to set up a similar venture in Old Lyme and invites other volunteers to join him at an initial planning meeting. Photo submitted.

OLD LYME — Do you believe that access to healthy food is important? Do you believe that a community should support members in need? Do you have an interest in growing food and cultivating relationships between neighbors, friends and community members?

If your answer to any or all of those questions is, ‘Yes,’ then you might wish to consider joining a discussion today to plan a community food garden to support the nutritional needs of the shoreline community by providing local food pantries with fresh produce.

During this virtual, kick-off planning meeting, Jim Ward, who conceived the idea of the community garden, explains, “We will discuss organization of a non-profit, fundraising, sustainability, outreach, education and community engagement.” There are two options timewise for the meeting, 12 noon or 6 p.m. and those wishing to attend are welcome to join either meeting.

To register for the meetings and obtain the Zoom log-in information or raise any questions, email Ward at jimdub@gmail.com​.

All are welcome and Ward stresses, “Differing viewpoints, experience, backgrounds and ages are encouraged. No gardening experience is required.”

Ward is a resident of Old Lyme since 2006 and his wife attended Old Lyme schools, then subsequently taught in the district. Asked how he came up with idea for the garden, he explained, ” While I have always been interested in gardening and landscaping, my interest in the garden was initiated while I was participating in the 2020 UCONN Master Gardening Program.’

Ward continued, “As a participant in the program you are responsible for a certain amount of outreach hours and I volunteered and continue to volunteer at the Food for All garden in Clinton.”

Noting, “The atmosphere at this very successful Food Bank garden was one of a small community,” he pointed out that there were always plenty of volunteers, who between them had, “A broad range of gardening skills, from no gardening experience to master gardeners.”

Moreover, Ward emphasized, “Everyone shared their knowledge of gardening and cooking … along with local and national political conversations.”

The catalyst for trying to start the endeavor in Old Lyme was simply, in Ward’s mind, the type of community found in Lyme-Old Lyme, which Ward felt, “Would be very supportive of this type of initiative.” He therefore set out, “to replicate the Food for All garden project.’

His plan was not only wholeheartedly supported in principle by the volunteers of the Clinton garden, but he noted that in addition, “They gave me access to their records and provided advice on the daily and annual demands of the garden.”

Finding a location for the garden in Old Lyme did not prove quite so straightforward, however. Ward said, “My wife and I researched town-owned lands defaulted to the Town, but didn’t find any that were suitable and could see why many were defaulted.”

Proposed site of the Lyme-Old Lyme Community Share Garden at Town Woods Field. Photo submitted.

Finally, the seed of an idea evolved, when, in Ward’s words, “We thought of Town Woods as it had water, electricity, parking, restrooms, proximity to the Senior Center and it served as a hub of activity for many residents.”

Asked what has happened since the potential site was identified, Ward explained, “Through generous cooperation of the Parks and Recreation Commission and with site approval by the Old Lyme Inland Wetlands Commission, a parcel of land behind the Field House at Town Woods Park has been secured.”

He added enthusiastically, “The location, amidst the park’s organically-managed fields, with access to water, electricity and parking, is ideal.”

The timeline for starting the project is, according to Ward, “Totally dependent on funds.” he states, “With the generous assistance of the Parks and Recreation Commission, we have cleared the large hurdles of land and water, so the next big hurdle will be the fencing for the garden.”

What is his best guess for how things will progress? Ward responds, “With that being said I would love to see a fence up, some site prep, and soil testing by this fall with a small planting next spring.”

The proposal was mentioned at the Old Lyme Board of Selectmen’s meeting last Tuesday, Feb. 16, when Selectwoman Mary Jo Nosal described the project as, “A really neat thing,” and “Pretty exciting.” First Selectman Timothy Griswold felt the board needed one of their members to “Prepare a checklist of what we [the board of selectmen] need to do,” and coordinate the effort between all the town boards and commissions involved. Selectman Chris Kerr agreed to take on that role.