Stroll Gil Boro’s Sculpture Grounds to Celebrate International Sculpture Day

A view across Gil Boro’s Sculpture Grounds looking towards Studio 80.

OLD LYME — This Saturday, April 24, the world will join in celebration of sculpture during the 7th annual International Sculpture Day, or ISDay.

The International Sculpture Center (ISC) invites artists, educators, collectors, curators and art enthusiasts across the globe to join in celebrating sculpture virtually. Take a minute to share images of your work, a favorite work by another sculptor, exhibitions, and any other way you celebrate sculpture.

Be sure to share the #ISDay hashtag on social media to be featured on sculpture.org and the ISC Instagram pages.

Three works by Gilbert Boro can be seen in this photo.

Here in Old Lyme, you will find Studio 80 + Sculpture Grounds, where nationally- and internationally-renowned sculptor Gilbert Boro lives and works. His beautiful property at 80-1 Lyme St. comprises 4.5 acres that roll gently down to the Lieutenant River.

There are more than 120 sculptures on display in the grounds, the majority created by Boro himself. It would be the perfect place to visit on ISDay.

Sculptor Gil Boro in his studio in Old Lyme.

The studio and indoor facilities are closed to the public until further notice due to Covid-19, but individuals are still welcome to stroll the grounds, enjoy nature and view the public artwork outdoors.

Admission is free from 9 a.m. to 5 p.m. daily but visitors must practice social distancing and other infection reduction strategies as outlined by the CDC

Sculptor Gil Boro has always encouraged visitors to touch and engage with the artwork, however, at this time, he asks that you refrain from all physical contact with the sculptures.

For more information on Studio 80 + Sculpture Grounds, visit this link.

April 19 COVID-19 Update: Cumulative Cases Up Three in Old Lyme to 329, Up One in Lyme to 103

LYME/OLD LYME — The Daily Data Report for Connecticut issued Monday, April 19, by the Connecticut Department of Public Health (CT-DPH) for data as at 8:30 p.m. Sunday, April 18, shows increases in the number of cumulative cases for both Lyme and Old Lyme.

These Daily Reports are not issued by CT DPH on Saturday or Sundays and therefore Monday’s data includes new cases from both weekend days.

Old Lyme – Cumulative Cases Up Three

TheDaily Data Report for Connecticut issued Monday, April 19,for data as at 8:30 p.m. Sunday, April 18, shows that Old Lyme has a cumulative total (since the outbreak began) of 321 confirmed COVID-19 cases and EIGHT probable casesmaking a TOTAL of 329 cases.

This represents an INCREASE OF THREE in the cumulative number of confirmed cases and NO CHANGE in the number of probable cases compared with those reported the previous day.

The total number of Old Lyme residents tested is 5,087, an increase of 13 over Friday’s number of 5,074.

Lyme – Cumulative Cases Up One

Lyme has a cumulative total (since the outbreak began) of 95 confirmed cases and 8 probable cases, making a TOTAL of 103 cases.

This represents an INCREASE OF ONE in the cumulative number of confirmed cases and NO CHANGEin the number of probable cases compared with those reported the previous day.

The total number of Lyme residents tested is 1,373, an increase of three over Friday’s number of 1,370.

Two-Week Case Rates

The report issued Monday, April 19, by the Connecticut Department of Public Health (CT DPH) for the average daily rate of new cases of COVID-19 by town during the past two weeks shows a  marginal improvement for the whole state.

The number of towns in the state in the Red (highest) Zone for two-week new case rates has fallen from 142 last week to 132 this week. Both Lyme and Old Lyme remain in the Zones in which they were last week.

Old Lyme is now one of the 15 towns in the Orange (second highest) Zone remaining in that Zone for the second week in a row.

Lyme is in the Gray Zone for two-week case rates, recording a fifth straight week in the lowest zone. Thirteen towns were in this zone last week and that number has risen to 21 this week. (Four zones are specified by the CT DPH — see details below.)

Overall, the number of towns in each zone is shown below with the previous week’s number in parentheses:

  • 21 (13) towns are now in the (lowest case rate) Gray Zone
  • 1 (4) are in the (lowest but one) Yellow Zone
  • 15 (10) are in the (second highest case rate) Orange Zone.

All the remaining 132 towns are in the Red Zone — last week’s number was 142.

Lyme joins 20 other towns in the Gray (lowest rate) Zone: Ashford, Bozrah, Bridgwater, Canaan, Chester, Colebrook, Cornwall,  Franklin, Goshen, Hampton, Hartland, Lisbon, Morris,  New Canaan, Norfolk, Scotland, Union, Voluntown, and Warren. Twenty-one towns in the Gray Zone reflects a significant and encouraging increase in the number of towns in that category over last week’s number of 13.

The Yellow (second lowest rate) Zone now has only one town, namely our neighbor, East Lyme.

Old Lyme joins 14 other towns in the Orange (second highest rate) Zone : Essex, Farmington, Hebron, Ledyard, Old Saybrook, Salem, Salisbury, Sharon, Simsbury, Stafford, Stonington, Waterford, Willington and Winchester.

  • The Gray category is defined as when the Average Daily Rate of COVID-19 Cases Among Persons Living in Community Settings per 100,000 Population By Town is less than five or less than five reported cases.
  • The Yellow category is defined as when the Average Daily Rate of COVID-19 Cases Among Persons Living in Community Settings per 100,000 Population By Town is between five and nine reported cases.
  • The Orange category is defined as when the Average Daily Rate of COVID-19 Cases Among Persons Living in Community Settings per 100,000 Population By Town is between 10 and 14.
  • The Red category is defined as when the Average Daily Rate of COVID-19 Cases Among Persons Living in Community Settings per 100,000 Population By Town exceeds 15.

In all cases, this rate does not include cases or tests among residents of nursing home, assisted living, or correctional facilities.

This report is issued daily, but only updated weekly on Thursdays. The most recent report was updated Thursday, April 15; the next updated report will be issued in the afternoon of Thursday, April 22.

More Detail on Two-Week Case Rates: Lyme Down, OL Constant

LLHD Director of Health Stephen Mansfield

On Thursday, April 15, Ledge Light Health District (LLHD) also issued their latest weekly report of COVID data for the municipalities within their District.

Ledge Light Director of Health Stephen Mansfield prefaces the report with the comment, “We are heartened to see a continued decrease in new cases throughout the District, with moderate decreases in the last two reporting periods. Our contact tracers continue to report clusters associated with daycares, schools, and workplaces, and transmissions linked to social gatherings and sporting events.

He stresses, however, “Although we are making great strides with our COVID vaccination program, it is still imperative that we remain diligent in our mitigation strategies.”

The latest two-week case rates announced Thursday, April 15, (from 3/28 to 4/10) have decreased in Lyme and held constant in Old Lyme.

The two-week case rates are as follows:

  • Old Lyme from 12.6 to 12.6
  • Lyme from 9.2 to 6.1

The same report shows that the case numbers in Week 1 and Week 2 respectively and recorded for the period 3/28 to 4/10  (compared with the previous two-week case rate for 3/14 to 3/27 shown in parentheses) are as follows:

  • Lyme had(2) cases in Week 1 and(1) in Week 2
  • Old Lyme had(9) cases in Week 1 and(4) in Week 2

This data was updated April 15, 2021. The next Ledge Light Weekly Data Report for its District will be issued in the afternoon of Thursday, April 22.

Vaccination Rates

At the request of several readers, we have started a new section reflecting the status of community vaccination rates in Lyme and Old Lyme. The data is taken from the COVID-19 Vaccinations by Town report published by CT-DPH, which is published roughly weekly.

Lyme is ahead of Old Lyme in terms of the percentage of its total population that have received a first dose, with 75.09 percent vaccinated compared with 65.78 percent in Old Lyme.

The percentages for both towns for the age segments 65-74 and 75+ are very encouraging with Lyme now having 108.76 percent of seniors 75 and above having received their first dose and 97.61 percent of the same age segment having received it in Old Lyme.

The detailed data below is the most recent and was updated April 15.

Old Lyme
Total population:  7,306
Estimated population age 65-74:  1,067
Estimated population age 75 and above:  794

[table id=12 /]

Lyme
Total population:  2,316
Estimated population age 65-74:  372
Estimated population age 75 and above:  274

[table id=11 /]

Three Fatalities in Old Lyme Since Pandemic Began, None in Lyme

According to the report mentioned above, there have now been THREE fatalities in Old Lyme. Asked Tuesday, Feb. 9, for details of this third fatality, Ledge Light Health Department Director of Health Stephen Mansfield responded, “We have not been notified of any recent deaths in Old Lyme. Keep in mind that that report is compiled by the Connecticut Department of Public Health; deaths are not reportable to local health districts.”

He added, “I can’t speak for their data sources.”

The two fatalities from Old Lyme previously reported in 2020 were a 61-year-old female and an 82-year-old male.

No fatalities have been reported in Lyme.

Connecticut Hospital Occupancy

At the request of several readers, we have added a new report showing the respective rates of hospital occupancy at local hospitals. The data for this report is obtained from the Connecticut Hospital Occupancy Report published weekly by the CT DPH and extracted from the United States Department of Health and Human Services (HHS) facility-level data for hospital utilization aggregated on a weekly basis (Friday to Thursday).

The most recent report is dated Feb. 19 and covers the two-week period from 2/12 to 2/18. No subsequent updates have been issued.

[table id=10 /]

Editor’s Note: The state issues a COVID-19 metric report daily around 4 p.m. Monday through Friday, which includes current data up to the previous evening. In light of the ongoing rise in Coronavirus cases, we publish a new weekday update reporting confirmed and probable COVID-19 cases in Lyme and Old Lyme. 

April 16 COVID-19 Update: No Change in Cumulative Cases for Lyme or Old Lyme

Photo by CDC on Unsplash

LYME/OLD LYME — The Daily Data Report for Connecticut issued Friday, April 16, by the Connecticut Department of Public Health (CT-DPH) for data as at 8:30 p.m. Thursday, April 15, shows no change in the number of cumulative cases for either Lyme or Old Lyme.

Old Lyme – No Change in Cumulative Cases

The Daily Data Report for Connecticut issued Friday, April 16, by the Connecticut Department of Public Health (CT-DPH) for data as at 8:30 p.m. Thursday, April 15, shows that Old Lyme has a cumulative total (since the outbreak began) of 318 confirmed COVID-19 cases and EIGHT probable casesmaking a TOTAL of 326 cases.

This represents NO CHANGE in the cumulative number of confirmed or probable cases compared with those reported the previous day.

The total number of Old Lyme residents tested is 5,074, an increase of 12 over Thursday’s number of 5,062.

Lyme – No Change in Cumulative Cases 

Lyme has a cumulative total (since the outbreak began) of 94 confirmed cases and 8 probable cases, making a TOTAL of 102 cases.

This represents NO CHANGE in the cumulative number of confirmed or probable cases compared with those reported the previous day.

The total number of Lyme residents tested is 1,370, an increase of six over Thursday’s number of 1,366.

Two-Week Case Rates

The report issued Friday, April 16, by the Connecticut Department of Public Health (CT DPH) for the average daily rate of new cases of COVID-19 by town during the past two weeks shows a  marginal improvement for the whole state.

The number of towns in the state in the Red (highest) Zone for two-week new case rates has fallen from 142 last week to 132 this week. Both Lyme and Old Lyme remain in the Zones in which they were last week.

Old Lyme is now one of the 15 towns in the Orange (second highest) Zone remaining in that Zone for the second week in a row.

Lyme is in the Gray Zone for two-week case rates, recording a fifth straight week in the lowest zone. Thirteen towns were in this zone last week and that number has risen to 21 this week. (Four zones are specified by the CT DPH — see details below.)

Overall, the number of towns in each zone is shown below with the previous week’s number in parentheses:

  • 21 (13) towns are now in the (lowest case rate) Gray Zone
  • 1 (4) are in the (lowest but one) Yellow Zone
  • 15 (10) are in the (second highest case rate) Orange Zone.

All the remaining 132 towns are in the Red Zone — last week’s number was 142.

Lyme joins 20 other towns in the Gray (lowest rate) Zone: Ashford, Bozrah, Bridgwater, Canaan, Chester, Colebrook, Cornwall,  Franklin, Goshen, Hampton, Hartland, Lisbon, Morris,  New Canaan, Norfolk, Scotland, Union, Voluntown, and Warren. Twenty-one towns in the Gray Zone reflects a significant and encouraging increase in the number of towns in that category over last week’s number of 13.

The Yellow (second lowest rate) Zone now has only one town, namely our neighbor, East Lyme.

Old Lyme joins 14 other towns in the Orange (second highest rate) Zone : Essex, Farmington, Hebron, Ledyard, Old Saybrook, Salem, Salisbury, Sharon, Simsbury, Stafford, Stonington, Waterford, Willington and Winchester.

  • The Gray category is defined as when the Average Daily Rate of COVID-19 Cases Among Persons Living in Community Settings per 100,000 Population By Town is less than five or less than five reported cases.
  • The Yellow category is defined as when the Average Daily Rate of COVID-19 Cases Among Persons Living in Community Settings per 100,000 Population By Town is between five and nine reported cases.
  • The Orange category is defined as when the Average Daily Rate of COVID-19 Cases Among Persons Living in Community Settings per 100,000 Population By Town is between 10 and 14.
  • The Red category is defined as when the Average Daily Rate of COVID-19 Cases Among Persons Living in Community Settings per 100,000 Population By Town exceeds 15.

In all cases, this rate does not include cases or tests among residents of nursing home, assisted living, or correctional facilities.

This report is issued daily, but only updated weekly on Thursdays. The most recent report was updated Thursday, April 15; the next updated report will be issued in the afternoon of Thursday, April 22.

More Detail on Two-Week Case Rates: Lyme Down, OL Constant

LLHD Director of Health Stephen Mansfield

On Thursday, April 15, Ledge Light Health District (LLHD) also issued their latest weekly report of COVID data for the municipalities within their District.

Ledge Light Director of Health Stephen Mansfield prefaces the report with the comment, “We are heartened to see a continued decrease in new cases throughout the District, with moderate decreases in the last two reporting periods. Our contact tracers continue to report clusters associated with daycares, schools, and workplaces, and transmissions linked to social gatherings and sporting events.

He stresses, however, “Although we are making great strides with our COVID vaccination program, it is still imperative that we remain diligent in our mitigation strategies.”

The latest two-week case rates announced Thursday, April 15, (from 3/28 to 4/10) have decreased in Lyme and held constant in Old Lyme.

The two-week case rates are as follows:

  • Old Lyme from 12.6 to 12.6
  • Lyme from 9.2 to 6.1

The same report shows that the case numbers in Week 1 and Week 2 respectively and recorded for the period 3/28 to 4/10  (compared with the previous two-week case rate for 3/14 to 3/27 shown in parentheses) are as follows:

  • Lyme had(2) cases in Week 1 and(1) in Week 2
  • Old Lyme had(9) cases in Week 1 and(4) in Week 2

This data was updated April 15, 2021. The next Ledge Light Weekly Data Report for its District will be issued in the afternoon of Thursday, April 22.

Vaccination Rates

At the request of several readers, we have started a new section reflecting the status of community vaccination rates in Lyme and Old Lyme. The data is taken from the COVID-19 Vaccinations by Town report published by CT-DPH, which is published roughly weekly.

Lyme is ahead of Old Lyme in terms of the percentage of its total population that have received a first dose, with 75.09 percent vaccinated compared with 65.78 percent in Old Lyme.

The percentages for both towns for the age segments 65-74 and 75+ are very encouraging with Lyme now having 108.76 percent of seniors 75 and above having received their first dose and 97.61 percent of the same age segment having received it in Old Lyme.

The detailed data below is the most recent and was updated April 15.

Old Lyme
Total population:  7,306
Estimated population age 65-74:  1,067
Estimated population age 75 and above:  794

[table id=12 /]

Lyme
Total population:  2,316
Estimated population age 65-74:  372
Estimated population age 75 and above:  274

[table id=11 /]

Three Fatalities in Old Lyme Since Pandemic Began, None in Lyme

According to the report mentioned above, there have now been THREE fatalities in Old Lyme. Asked Tuesday, Feb. 9, for details of this third fatality, Ledge Light Health Department Director of Health Stephen Mansfield responded, “We have not been notified of any recent deaths in Old Lyme. Keep in mind that that report is compiled by the Connecticut Department of Public Health; deaths are not reportable to local health districts.”

He added, “I can’t speak for their data sources.”

The two fatalities from Old Lyme previously reported in 2020 were a 61-year-old female and an 82-year-old male.

No fatalities have been reported in Lyme.

Connecticut Hospital Occupancy

At the request of several readers, we have added a new report showing the respective rates of hospital occupancy at local hospitals. The data for this report is obtained from the Connecticut Hospital Occupancy Report published weekly by the CT DPH and extracted from the United States Department of Health and Human Services (HHS) facility-level data for hospital utilization aggregated on a weekly basis (Friday to Thursday).

The most recent report is dated Feb. 19 and covers the two-week period from 2/12 to 2/18. No subsequent updates have been issued.

[table id=10 /]

Editor’s Note: The state issues a COVID-19 metric report daily around 4 p.m. Monday through Friday, which includes current data up to the previous evening. In light of the ongoing rise in Coronavirus cases, we publish a new weekday update reporting confirmed and probable COVID-19 cases in Lyme and Old Lyme. 

April 15 COVID-19 Update: Lyme (Gray), Old Lyme (Orange) Stay in Same Two-Week Case Rate Zones as Last Week; Two New Cases Take Lyme’s Cumulative Total to 102, OL Holds at 326

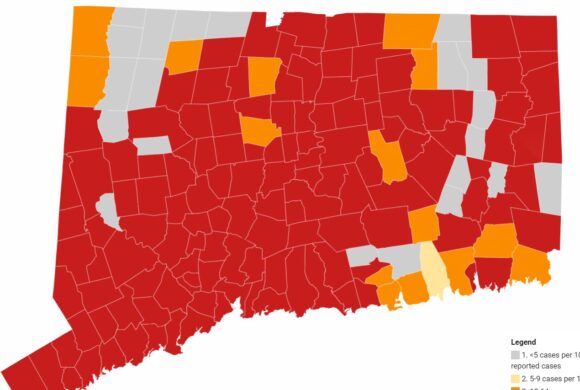
This map, updated April 15, shows the average daily rate of new cases of COVID-19 by town during the past two weeks. The Town of Old Lyme remains in the Orange (second highest) Zone, while Lyme stays in the (lowest) Gray Zone. (Only cases among persons living in community settings are included in this map; the map does not include cases among people who reside in nursing home, assisted living, or correctional facilities.)

LYME/OLD LYME — The report issued Thursday, April 15, by the Connecticut Department of Public Health (CT DPH) for the average daily rate of new cases of COVID-19 by town during the past two weeks shows a  marginal improvement for the whole state.

The number of towns in the state in the Red (highest) Zone for two-week new case rates has fallen from 142 last week to 132 this week. Both Lyme and Old Lyme remain in the Zones in which they were last week.

Old Lyme is now one of the 15 towns in the Orange (second highest) Zone remaining in that Zone for the second week in a row.

Lyme is in the Gray Zone for two-week case rates, recording a fifth straight week in the lowest zone. Thirteen towns were in this zone last week and that number has risen to 21 this week. (Four zones are specified by the CT DPH — see details below.)

Overall, the number of towns in each zone is shown below with the previous week’s number in parentheses:

  • 21 (13) towns are now in the (lowest case rate) Gray Zone
  • 1 (4) are in the (lowest but one) Yellow Zone
  • 15 (10) are in the (second highest case rate) Orange Zone.

All the remaining 132 towns are in the Red Zone — last week’s number was 142.

Lyme joins 20 other towns in the Gray (lowest rate) Zone: Ashford, Bozrah, Bridgwater, Canaan, Chester, Colebrook, Cornwall,  Franklin, Goshen, Hampton, Hartland, Lisbon, Morris,  New Canaan, Norfolk, Scotland, Union, Voluntown, and Warren. Twenty-one towns in the Gray Zone reflects a significant and encouraging increase in the number of towns in that category over last week’s number of 13.

The Yellow (second lowest rate) Zone now has only one town, namely our neighbor, East Lyme.

Old Lyme joins 14 other towns in the Orange (second highest rate) Zone : Essex, Farmington, Hebron, Ledyard, Old Saybrook, Salem, Salisbury, Sharon, Simsbury, Stafford, Stonington, Waterford, Willington and Winchester.

  • The Gray category is defined as when the Average Daily Rate of COVID-19 Cases Among Persons Living in Community Settings per 100,000 Population By Town is less than five or less than five reported cases.
  • The Yellow category is defined as when the Average Daily Rate of COVID-19 Cases Among Persons Living in Community Settings per 100,000 Population By Town is between five and nine reported cases.
  • The Orange category is defined as when the Average Daily Rate of COVID-19 Cases Among Persons Living in Community Settings per 100,000 Population By Town is between 10 and 14.
  • The Red category is defined as when the Average Daily Rate of COVID-19 Cases Among Persons Living in Community Settings per 100,000 Population By Town exceeds 15.

In all cases, this rate does not include cases or tests among residents of nursing home, assisted living, or correctional facilities.

This report is issued daily, but only updated weekly on Thursdays. The most recent report was updated Thursday, April 15; the next updated report will be issued in the afternoon of Thursday, April 22.

More Detail on Two-Week Case Rates: Lyme Down, OL Constant

LLHD Director of Health Stephen Mansfield

On Thursday, April 15, Ledge Light Health District (LLHD) also issued their latest weekly report of COVID data for the municipalities within their District.

Ledge Light Director of Health Stephen Mansfield prefaces the report with the comment, “We are heartened to see a continued decrease in new cases throughout the District, with moderate decreases in the last two reporting periods. Our contact tracers continue to report clusters associated with daycares, schools, and workplaces, and transmissions linked to social gatherings and sporting events.

He stresses, however, “Although we are making great strides with our COVID vaccination program, it is still imperative that we remain diligent in our mitigation strategies.”

The latest two-week case rates announced Thursday, April 15, (from 3/28 to 4/10) have decreased in Lyme and held constant in Old Lyme.

The two-week case rates are as follows:

  • Old Lyme from 12.6 to 12.6
  • Lyme from 9.2 to 6.1

The same report shows that the case numbers in Week 1 and Week 2 respectively and recorded for the period 3/28 to 4/10  (compared with the previous two-week case rate for 3/14 to 3/27 shown in parentheses) are as follows:

  • Lyme had(2) cases in Week 1 and(1) in Week 2
  • Old Lyme had(9) cases in Week 1 and(4) in Week 2

This data was updated April 15, 2021. The next Ledge Light Weekly Data Report for its District will be issued in the afternoon of Thursday, April 22.

Old Lyme – No Change in Cumulative Cases

The Daily Data Report for Connecticut issued Thursday, April 15, by the Connecticut Department of Public Health (CT-DPH) for data as at 8:30 p.m. Wednesday, April 14, shows that Old Lyme has a cumulative total (since the outbreak began) of 318 confirmed COVID-19 cases and EIGHT probable casesmaking a TOTAL of 326 cases.

This represents NO CHANGE in the cumulative number of confirmed or probable cases compared with those reported the previous day.

The total number of Old Lyme residents tested is 5,062, an increase of six over Wednesday’s number of 5,056.

Lyme – Cumulative Cases Up Two

Lyme has a cumulative total (since the outbreak began) of 94 confirmed cases and 8 probable cases, making a TOTAL of 102 cases.

This represents INCREASE of TWO in the cumulative number of confirmed cases compared with those reported Wednesday, April 14, and NO CHANGE in the number of probable cases.

The total number of Lyme residents tested is 1,366, an increase of four over Wednesday’s number of 1,365.

Vaccination Rates

At the request of several readers, we have started a new section reflecting the status of community vaccination rates in Lyme and Old Lyme. The data is taken from the COVID-19 Vaccinations by Town report published by CT-DPH, which is published roughly weekly.

Lyme is ahead of Old Lyme in terms of the percentage of its total population that have received a first dose, with 75.09 percent vaccinated compared with 65.78 percent in Old Lyme.

The percentages for both towns for the age segments 65-74 and 75+ are very encouraging with Lyme now having 108.76 percent of seniors 75 and above having received their first dose and 97.61 percent of the same age segment having received it in Old Lyme.

The detailed data below is the most recent and was updated April 15.

Old Lyme
Total population:  7,306
Estimated population age 65-74:  1,067
Estimated population age 75 and above:  794

[table id=12 /]

Lyme
Total population:  2,316
Estimated population age 65-74:  372
Estimated population age 75 and above:  274

[table id=11 /]

Three Fatalities in Old Lyme Since Pandemic Began, None in Lyme

According to the report mentioned above, there have now been THREE fatalities in Old Lyme. Asked Tuesday, Feb. 9, for details of this third fatality, Ledge Light Health Department Director of Health Stephen Mansfield responded, “We have not been notified of any recent deaths in Old Lyme. Keep in mind that that report is compiled by the Connecticut Department of Public Health; deaths are not reportable to local health districts.”

He added, “I can’t speak for their data sources.”

The two fatalities from Old Lyme previously reported in 2020 were a 61-year-old female and an 82-year-old male.

No fatalities have been reported in Lyme.

Connecticut Hospital Occupancy

At the request of several readers, we have added a new report showing the respective rates of hospital occupancy at local hospitals. The data for this report is obtained from the Connecticut Hospital Occupancy Report published weekly by the CT DPH and extracted from the United States Department of Health and Human Services (HHS) facility-level data for hospital utilization aggregated on a weekly basis (Friday to Thursday).

The most recent report is dated Feb. 19 and covers the two-week period from 2/12 to 2/18. No subsequent updates have been issued.

[table id=10 /]

Editor’s Note: The state issues a COVID-19 metric report daily around 4 p.m. Monday through Friday, which includes current data up to the previous evening. In light of the ongoing rise in Coronavirus cases, we publish a new weekday update reporting confirmed and probable COVID-19 cases in Lyme and Old Lyme. 

April 14 COVID-19 Update: Old Lyme’s Cumulative Cases Up Two to 326, Lyme Holds at 100

LYME/OLD LYME — The Daily Data Report for Connecticut issued Wednesday, April 14, by the Connecticut Department of Public Health (CT-DPH) for data as at 8:30 p.m. Tuesday, April 13, shows that two new cases were reported in Old Lyme taking its cumulative total of COVID-19 cases since the pandemic began to 326. This number reflects an increase of nine cases since last Thursday.

Meanwhile, Lyme again reported a total of 100 cases reflecting no new cases in its cumulative total of COVID-19 cases since the pandemic began compared with the number reported the previous day.

Old Lyme – Cumulative Cases Up Two

The Daily Data Report issued Wednesday, April 14, shows Old Lyme has a cumulative total (since the outbreak began) of 318 confirmed cases and 8 probable cases, making a TOTAL ofcases

This represents an INCREASE of TWO in the cumulative number of confirmed cases and NO CHANGE in the number of probable cases compared with those reported the previous day.

The total number of Old Lyme residents tested is 5,056 an increase of 13 over the previous day’s number of 5,043.

Lyme – No Change in Cumulative Cases

The Daily Data Report issued Wednesday, April 14, shows that Lyme has a cumulative total (since the outbreak began) of 92 confirmed COVID-19 cases and EIGHT probable casesmaking a TOTAL of 100 cases.

This represents NO CHANGE in the cumulative number of confirmed or probable cases compared with those reported the previous day.

The total number of Lyme residents tested is 1,366, an increase of one over the previous day’s number of 1,365.

Two-Week New Case Rates Show Marginal Improvement for State, Local Towns

The number of towns in the state in the Red (highest) Zone for two-week new case rates has fallen from 146 last week to 142 this week. Old Lyme, which last week was in the Red Zone, is now one of the 10 towns in the Orange (second highest) Zone.

Lyme remains in the Gray Zone for two-week case rates, recording a fourth straight week in the lowest zone. Thirteen towns were in this zone last week and that number is the same this week. (Four zones are specified by the CT DPH — see details below.)

Overall, the number of towns in each zone is shown below with the previous week’s number in parentheses:

  • 13 (13) towns are now in the (lowest case rate) Gray Zone
  • 4 (2) are in the (lowest but one) Yellow Zone
  • 10 (8) are in the (second highest case rate) Orange Zone.

All the remaining 142 towns are in the Red Zone.

Lyme joins 12 other towns in the Gray (lowest rate) Zone: Ashford, Canaan, Chaplin, Chester, Cornwall, Eastford, Franklin, Hampton, New Canaan, Norfolk, Scotland, and Warren.

The Yellow (second lowest rate) Zone now has four towns: Essex, Lisbon, Salem and Willington.

Old Lyme joins nine other towns in the Orange (second highest rate) Zone : Barkhamsted, Canton, East Lyme, Pomfret, Sharon, Simsbury, Stafford, Stonington, and Waterford.

  • The gray category is defined as when the Average Daily Rate of COVID-19 Cases Among Persons Living in Community Settings per 100,000 Population By Town is less than five or less than five reported cases.
  • The yellow category is defined as when the Average Daily Rate of COVID-19 Cases Among Persons Living in Community Settings per 100,000 Population By Town is between five and nine reported cases.
  • The orange category is defined as when the Average Daily Rate of COVID-19 Cases Among Persons Living in Community Settings per 100,000 Population By Town is between 10 and 14.
  • The red category is defined as when the Average Daily Rate of COVID-19 Cases Among Persons Living in Community Settings per 100,000 Population By Town exceeds 15.

In all cases, this rate does not include cases or tests among residents of nursing home, assisted living, or correctional facilities.

This report is issued daily, but only updated weekly on Thursdays. The most recent report was updated Thursday, April 8; the next updated report will be issued in the afternoon of Thursday, April 15.

More Detail on Two-Week Case Rates

Ledge Light Health Director Stephen Mansfield

On Thursday, April 8, Ledge Light Health District (LLHD) also issued their latest weekly report of COVID data for the municipalities within their District. Ledge Light Director of Health Stephen Mansfield prefaces the report with the comment, “We continue to see relatively steady case numbers within our jurisdiction. Our contact tracers report clusters associated with daycares, schools, and workplaces, and transmissions linked to social gatherings and sporting events.”

He stresses, however, “Although we are making great strides with our COVID vaccination program, it is still imperative that we remain diligent in our mitigation strategies.”

The latest two-week case rates announced Thursday, April 8 (from 3/21 to 4/3) have decreased in both Lyme and Old Lyme.

The two-week case rates are as follows:

  • Old Lyme from 15.5 to 12.6
  • Lyme from 12.2 to 9.2

The same report shows that the case numbers in Week 1 and Week 2 respectively and recorded for the period 3/21 to 4/3  (compared with the previous two-week case rate for 3/14 to 3/27 shown in parentheses) are as follows:

  • Lyme had 2 (2) cases in Week 1 and 1 (2) in Week 2
  • Old Lyme had 9 (7) cases in Week 1 and (9) in Week 2

This data was updated April 8, 2021. The next Ledge Light Weekly Data Report for its District will be issued in the afternoon of Thursday, April 15.

Vaccination Rates

At the request of several readers, we have started a new section reflecting the status of community vaccination rates in Lyme and Old Lyme. The data is taken from the COVID-19 Vaccinations by Town report published by CT-DPH, which is published roughly weekly.

Lyme is now ahead of Old Lyme in terms of the percentage of its total population that have received a first dose, with 54.36 percent vaccinated compared with 48.63 percent in Old Lyme.

The percentages for both towns for the age segments 65-74 and 75+ are very encouraging with Lyme now having 105.47 percent of seniors 75 and above having received their first dose and 95.09 percent of the same age segment having received it in Old Lyme.

The detailed data below is the most recent and was updated April 1.

Old Lyme
Total population:  7,306
Estimated population age 65-74:  1,067
Estimated population age 75 and above:  794

[table id=12 /]

Lyme
Total population:  2,316
Estimated population age 65-74:  372
Estimated population age 75 and above:  274

[table id=11 /]

Three Fatalities in Old Lyme Since Pandemic Began, None in Lyme

According to the report mentioned above, there have now been THREE fatalities in Old Lyme. Asked Tuesday, Feb. 9, for details of this third fatality, Ledge Light Health Department Director of Health Stephen Mansfield responded, “We have not been notified of any recent deaths in Old Lyme. Keep in mind that that report is compiled by the Connecticut Department of Public Health; deaths are not reportable to local health districts.”

He added, “I can’t speak for their data sources.”

The two fatalities from Old Lyme previously reported in 2020 were a 61-year-old female and an 82-year-old male.

No fatalities have been reported in Lyme.

Connecticut Hospital Occupancy

At the request of several readers, we added a new report showing the respective rates of hospital occupancy at local hospitals. The data for this report is obtained from the Connecticut Hospital Occupancy Report published weekly by the CT DPH and extracted from the United States Department of Health and Human Services (HHS) facility-level data for hospital utilization aggregated on a weekly basis (Friday to Thursday).

Since the most recent report is dated Feb. 19 and no subsequent updates have been issued, we have discontinued publishing this report until a new update is issued.

Editor’s Note: The state issues a COVID-19 metric report daily around 4 p.m. Monday through Friday, which includes current data up to the previous evening. In light of the ongoing rise in Coronavirus cases, we publish a new weekday update reporting confirmed and probable COVID-19 cases in Lyme and Old Lyme.