Lyme Art Association Celebrates its Centennial in True ‘Twenties’ Style

Replicating the traditions of the early part of the last century, artists associated with the Lyme Art Association set up their easels at different points along Lyme St. on Saturday, and painted local scenes. Photo by Anne Smith Brandenburg.

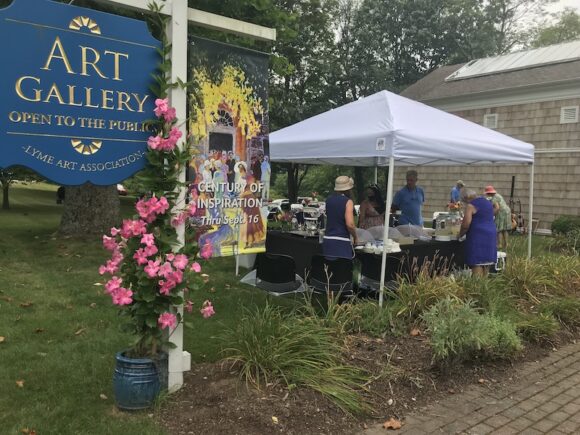
OLD LYME — On Saturday, the Lyme Art Association (LAA) celebrated 100 years (and one day!) since their gallery opened with art and awards, teas and ‘The Twenties,’ and much mirth and merriment all around.

Photo by Anne Smith Brandenburg.

Some artists took their palettes to the river.

Photo by Anne Smith Brandenburg.

Artwork was created in all sizes …

Photo by Anne Smith Brandenburg.

… and colors.

Photo by Anne Smith Brandenburg.

Some was small …

Photo by Anne Smith Brandenburg.

… while others were large.

Photo by Anne Smith Brandenburg.

But concentration was high wherever the artists were working and the results were truly remarkable.

Photo by Suzanne Thompson.

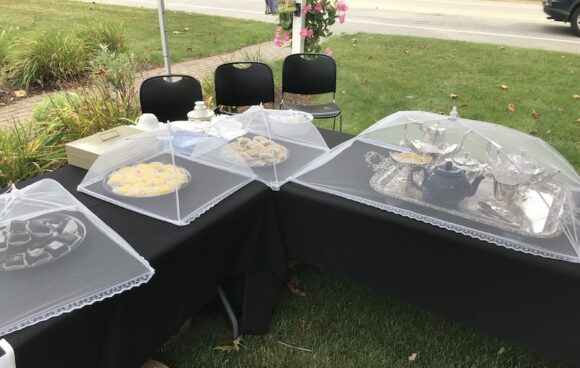
Tea was served ‘Twenties’ style at the LAA during the afternoon, celebrating the period when the Association first opened its doors …

Photo by Suzanne Thompson

… with delicious goodies for all.

Photo by Linda Ahnert.

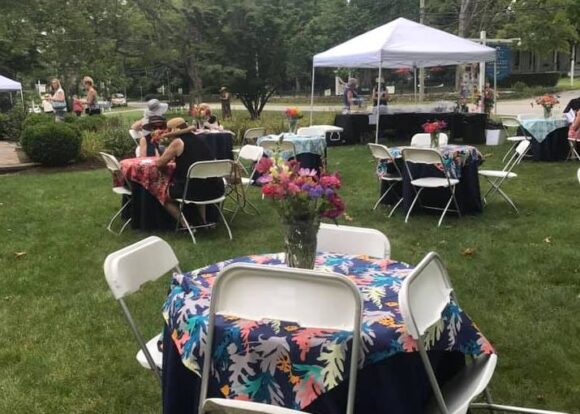
There were tables with flowery cloths and flowers in vases everywhere …

Photo by Linda Ahnert.

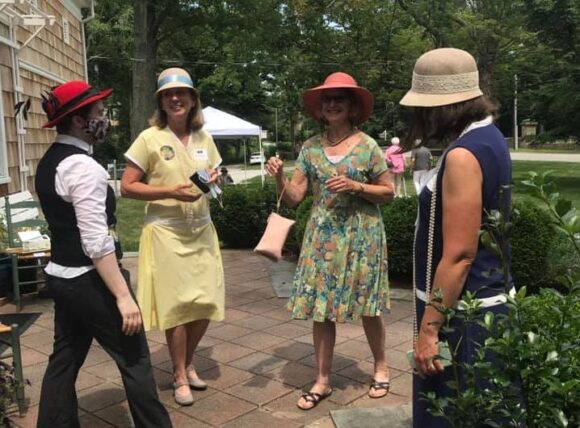
The weather was perfect, faces were smiling, and these ladies in their ‘Twenties’ tea-dresses were clearly having a lovely time.

Photo by Linda Ahnert.

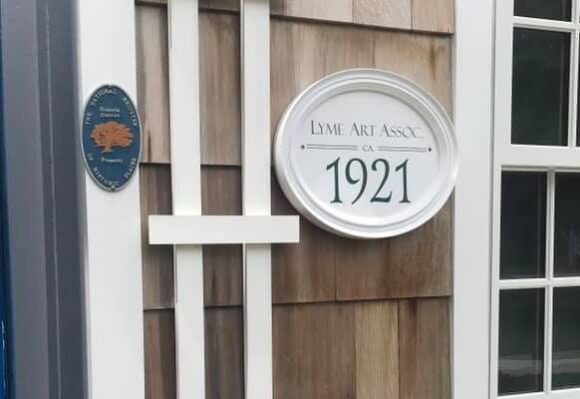
This plaque reminded guests of the joyful date they were all celebrating …

Photo by Linda Ahnert.

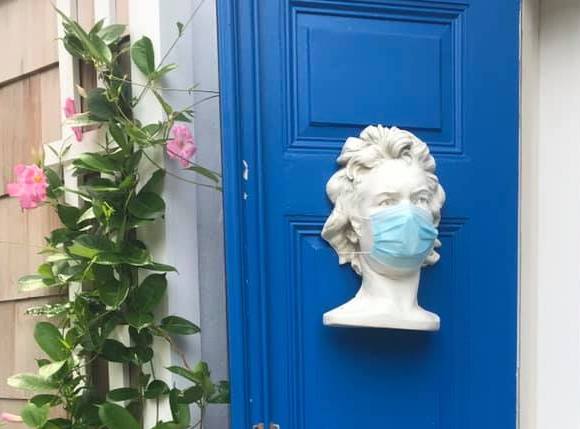
… while this mask reminded guests of the unwelcome newcomer in our midst.

All the freshly-painted artwork was gathered on the LAA’s lawn where guests studied it intently to decide  whether to make a purchase.

There was so much wonderful work from which to choose …

… but Lyme Street resident Lynn Fairfield-Sonn knew precisely which piece she wanted to buy. It was the beautiful painting of her house depicting herself and husband Jim on the porch!

Cooley Gallery owner Jeff Cooley (right) announced the winners of the ‘Wet-Paint Contest,’ who gathered for a photo with LAA Board Chairman Harley Bartlett (left) after the presentation of awards.

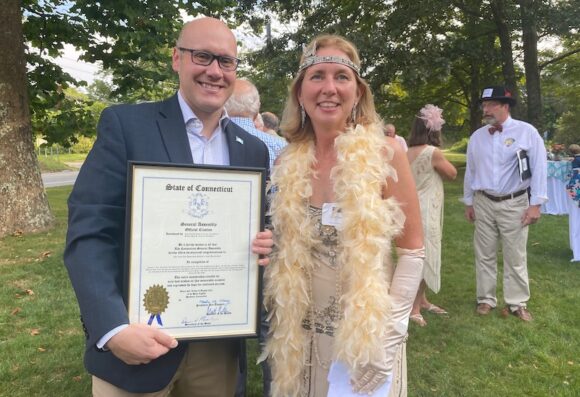
State Representative Devin Carney (R-23rd) was on hand to present LAA Executive Director Laurie Pavlos with a Proclamation from the State House and Senate honoring the event.

The LAA Board Chair, Harley Bartlett (center), cheerfully shared a smile with the LAA Executive Director Laurie Pavlos (right) and Development Director Elsbeth Dowd (left.)

Local artist Jack Montmeat was awarded first prize in the Lyme Art Association’s summer exhibition A Century of Inspiration.

The early evening morphed into the Centennial Frolic with a 1920s-themed fundraiser for the Second Century Skylight Project. This delightful event celebrated the next 100 years of the LAA’s historic gallery in the spirit of their founders with fabulous ‘Twenties’ attire being the fashion theme.

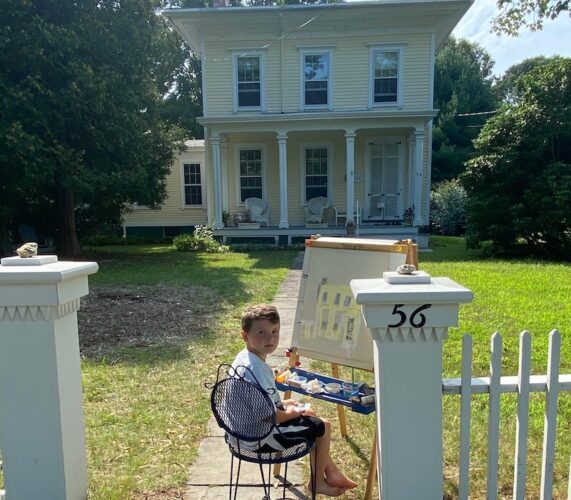
And so this memorable day came to an end, but let us not forget the artists of the future, who will see the LAA through their next 100 years … and here is one of them, Gideon Halferty — the seven-year-old son of Esther and Paul — hard at work in front of his house on Lyme Street!

Aug. 10 COVID-19 Update: Four New Cases in Old Lyme Take Cumulative Total to 360, Lyme Holds at 113

LYME/OLD LYME — The Daily Data Report issued Tuesday, Aug. 10, shows that Old Lyme has reported four new confirmed COVID-19 cases since our last report on Aug. 6 . This takes Old Lyme’s cumulative total of confirmed cases to 360, while Lyme has had no new confirmed cases keeping their total at 113.

Fatalities Due to COVID-19 in Lyme, Old Lyme

There is no change in the number of fatalities reported in either Lyme (0) or Old Lyme (3).

The first two fatalities from Old Lyme, which were reported in 2020, were a 61-year-old female and an 82-year-old male. Details of the third, which was reported in 2021, have not been made available.

Visit this link for our Aug. 6 update, which includes statewide data.

Aug. 6 COVID-19 Update: Old Lyme Moves into (Higher) Orange Zone for Two-Week Case Rates; OL’s Cumulative Case Total Rises to 356, Lyme’s Up One to 113

This map, updated Aug. 5, 2021 shows the average daily rate of new cases of COVID-19 by town during the past two weeks. Lyme is still in the (lowest) Gray Zone, but Old Lyme has moved into the Orange Zone. Only cases among persons living in community settings are included in this map; the map does not include cases among people who reside in nursing home, assisted living, or correctional facilities.) Map: Ver 12.1.2020 Source: CT Department of Public Health Get the data Created with Datawrapper. Details in italics are the same for each of the maps included in this article.

LYME/OLD LYME — The Daily Data Report for Connecticut issued Thursday, Aug. 5, by the Connecticut Department of Public Health  (CT-DPH) for data as at 8:30 p.m. Wednesday, Aug. 4, shows the latest average daily rate of new cases of COVID-19 by town during the past two weeks (see map above.)

The picture is worrying and reflects national trends with substantial increases in the number of towns in each zone, except Gray (the lowest case rate zone.) These increases are due primarily to the increased virulence of the Delta Variant.

Six towns are now in the Red (highest case rate) Zone (last week’s number was four) and 33 in the Orange (second highest case rate) Zone — last week’s number was four. See detailed description of the zones in italics below.

The towns in the Red Zone are East Hampton, Easton, Hampton, Hartford, Hartland, North Stonington*, and Thomaston.

There are 33 towns in the Orange Zone including Old Lyme, Waterford, New London, Groton, Ledyard and Stonington, all of which are in the Ledge Light Health District, as are the towns denoted with an * in the other zones.

East Lyme* has reentered the Yellow (second lowest) Zone along with more than 50 other Connecticut towns.

All remaining towns in the state, including Lyme*, are in the Gray (lowest rate) Zone. This is the 20th straight week that Lyme is in the Gray Zone.

New Cases in Both Towns

The Daily Data Report issued Friday, Aug.6, shows that Old Lyme has reported two new confirmed COVID-19 cases since our last report on Aug. 2 . This takes Old Lyme’s cumulative total of confirmed cases to 356, while Lyme has had one new case taking their total to 113.

This map, updated July 29, 2021 shows the average daily rate of new cases of COVID-19 by town during the past two weeks. Lyme is still in the (lowest) Gray Zone, but Old Lyme has moved into the Yellow Zone.

  • The Gray category is defined as when the Average Daily Rate of COVID-19 Cases Among Persons Living in Community Settings per 100,000 Population By Town is less than five or less than five reported cases.
  • The Yellow category is defined as when the Average Daily Rate of COVID-19 Cases Among Persons Living in Community Settings per 100,000 Population By Town is between five and nine reported cases.
  • The Orange category is defined as when the Average Daily Rate of COVID-19 Cases Among Persons Living in Community Settings per 100,000 Population By Town is between 10 and 14.
  • The Red category is defined as when the Average Daily Rate of COVID-19 Cases Among Persons Living in Community Settings per 100,000 Population By Town exceeds 15.
  • In all cases, this rate does not include cases or tests among residents of nursing home, assisted living, or correctional facilities.

The following maps show has the picture of COVID-19 cases has gone from an almost totally red map back in Dec. 2020 to an almost all-gray map on June 17, 2021 and then back to a map with all colors represented in substantial number again.

Stephen Mansfield prefaced the LLHD report sent out yesterday with these words, “We are seeing a significant uptick in new cases, as well as outbreaks associated with family gatherings and other social events.”

He added, “Although we are making great strides with our COVID vaccination program, it is imperative that we remain diligent in our mitigation strategies. We strongly advise everyone to wear masks indoors in public settings, regardless of vaccination status”

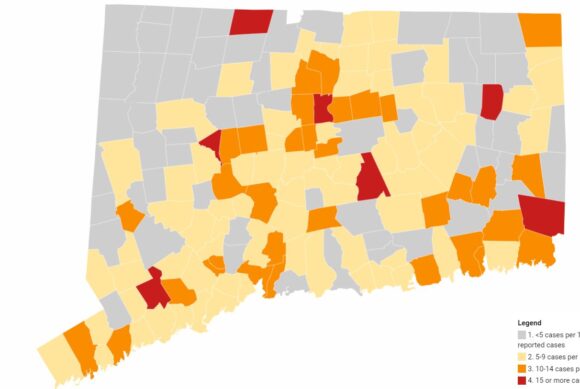
The map below is from July 22, when two towns, Franklin and Salem, were in the Red Zone (indicating the highest rate of COVID-19 new cases), which is up one from the previous week, and Andover remained in the (second highest rate) Orange Zone (down from two towns last week.)

Eight towns were in the Yellow Zone (indicating the lowest but one rate of COVID-19 new cases), which is up from two last week. They were Clinton, East Hampton, Manchester, Newington, Stonington, Westbrook, Windsor and Windsor Locks.

This map, updated July 22, 2021 shows the average daily rate of new cases of COVID-19 by town during the past two weeks. Both Lyme and Old Lyme are still in the (lowest) Gray Zone.

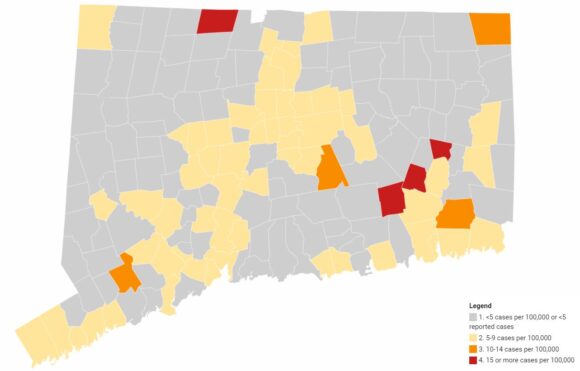
The map below is from July 15, when one town, Franklin, was in the Red Zone (indicating the highest rate of COVID-19 new cases) and another two, Salem and Andover, were in the (second highest rate) Orange Zone. New Hartford and Griswold were in the Yellow Zone (indicating the lowest but one rate of COVID-19 new cases.)

This map, updated July 15, 2021 shows the average daily rate of new cases of COVID-19 by town during the past two weeks. Both Lyme and Old Lyme are still in the (lowest) Gray Zone.

The map below is from July 8, when New Hartford was the sole town in the Yellow Zone.

This map, updated July 8, 2021 shows the average daily rate of new cases of COVID-19 by town during the past two weeks. Both Lyme and Old Lyme are still in the (lowest) Gray Zone.

The map below is from July 1, when Marlborough and Prospect were in the Yellow Zone.

This map, updated July 1, 2021 shows the average daily rate of new cases of COVID-19 by town during the past two weeks. Both Lyme and Old Lyme are still in the (lowest) Gray Zone.

The map below is from June 24, when Somers, Prospect and Bolton were in the Yellow Zone.

This map, updated June 24, shows the average daily rate of new cases of COVID-19 by town during the past two weeks. Both Lyme and Old Lyme are still in the (lowest) Gray Zone.

This is the June 17 map, when just one town, Bolton, was in the Yellow Zone.

This map, updated June 17, shows the average daily rate of new cases of COVID-19 by town during the past two weeks. Both Lyme and Old Lyme are still in the (lowest) Gray Zone.

For comparison, the map below is from June 3 and shows one town, Waterbury, in the Orange Zone and 21 towns in the Yellow Zone, down from 48 the previous week. The towns in the Yellow Zone were: Ansonia, Beacon Falls, Bloomfield, Brooklyn, Coventry, Cromwell, Derby, East Hartford, East Haven, Granby, Hamden, Hartford, Manchester, New Britain, New Haven, New London, Putnam, Rocky Hill, Shelton, Waterford and Windsor.

This map, updated June 3, shows the average daily rate of new cases of COVID-19 by town during the previous two weeks. Both Lyme and Old Lyme are in the (lowest) Gray Zone.

Below is the map from May 27 that showed one town in the Red Zone, Putnam, and 10 towns in the Orange Zone.

This map, updated May 27, shows the average daily rate of new cases of COVID-19 by town during the past two weeks. Both Lyme and Old Lyme were still in the (lowest) Gray Zone.

Compare the maps above with the one we published Dec. 18, 2020 to see the remarkable progress that has been made with controlling the spread of the virus through expansion of vaccination rates and improved mitigation strategies.
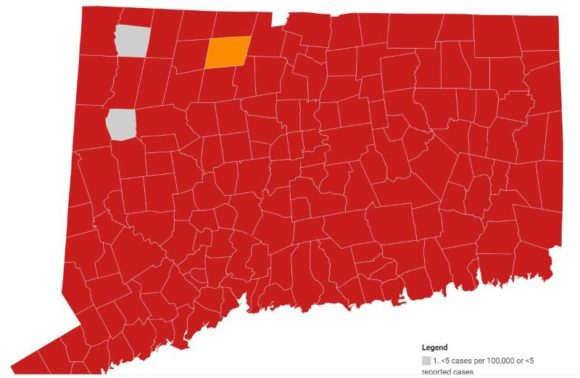
Map of Connecticut dated Dec. 17, 2020 showing both Lyme and Old Lyme now in the CT DPH-identified ‘Red Zone.’ This is defined as when the Average Daily Rate of COVID-19 Cases Among Persons Living in Community Settings per 100,000 Population By Town is over 15.

Vaccination rates in Lyme and Old Lyme are encouraging with 82.8 percent of the population in Lyme having received at least one dose of the COVID-19 vaccine and the equivalent number for Old Lyme being 74.5. percent.

Percentages for the fully vaccinated are 79.5 for Lyme and 71.1 for Old Lyme.

These rates remain among the higher percentages in the state.

Information regarding vaccination opportunities and other relevant information can be found at https://llhd.org/coronavirus-covid-19-situation/covid-19-vaccine/

The following link provides centralized access to Connecticut COVID data: https://data.ct.gov/stories/s/COVID-19-data/wa3g-tfvc/

July 29 COVID-19 Update: Old Lyme Back in Yellow Zone for Two-Week Case Rate; One New Case in OL Takes Cumulative Total to 351, Lyme Holds at 112

This map, updated July 29, 2021 shows the average daily rate of new cases of COVID-19 by town during the past two weeks. Lyme is still in the (lowest) Gray Zone, but Old Lyme has moved into the Yellow Zone. Only cases among persons living in community settings are included in this map; the map does not include cases among people who reside in nursing home, assisted living, or correctional facilities.) Map: Ver 12.1.2020 Source: CT Department of Public Health Get the data Created with Datawrapper. Details in italics are the same for each of the maps included in this article.

‘New London County has moved into the category of “substantial transmission”’ (Deidre S. Gifford, MD, MPH, Senior Advisor to the Governor for Health and Human Services, and Acting Connecticut Department of Public Health Commissioner)

LYME/OLD LYME — The Daily Data Report for Connecticut issued Thursday, July 29, by the Connecticut Department of Public Health  (CT-DPH) for data as at 8:30 p.m. Wednesday, July 28, shows the latest average daily rate of new cases of COVID-19 by town during the past two weeks (see map above.)

The picture is distressing, reflecting national trends, with four towns now in the Red (highest case rate) Zone and four in the Orange (second highest) Zone. See detailed description of the zones in italics below.

The towns in the Red Zone are Harland, Salem, Bozrah and Sprague. The towns in the Orange Zone are Easton, East Hampton, Ledyard and Thompson.

Old Lyme has reentered the Yellow (second lowest) Zone along with more than 50 other Connecticut towns. All remaining towns in the state, including Lyme, are in the Gray (lowest rate) Zone. This is the 19th straight week that Lyme is in the Gray Zone.

This same report issued Thursday, July 29, also shows that Old Lyme has reported one new confirmed COVID-19 case. This takes Old Lyme’s cumulative total of confirmed cases to 351, while Lyme’s holds steady at 112.

In breaking news, Ledge Light Director of Health Stephen Mansfield sent out a statement at 8:10 a.m. this morning from Deidre S. Gifford, MD, MPH, Senior Advisor to the Governor for Health and Human Services, and Acting Connecticut Department of Public Health Commissioner, which states, “According to new guidance released by CDC this week, all individuals over the age of 2 years—whether vaccinated or unvaccinated—in counties with substantial transmission of COVID-19 should wear masks in public indoor spaces.

As of today, Hartford, New Haven and New London Counties have moved into the category of “substantial transmission” per the CDC classification system.  The Connecticut Department of Public Health strongly recommends that individuals who live in, work in, or are visiting towns located in Hartford, New Haven or New London County follow this recommendation.”

Mansfield said yesterday in a different communication, “The increase in COVID transmission in New London County is cause for concern.”

  • The Gray category is defined as when the Average Daily Rate of COVID-19 Cases Among Persons Living in Community Settings per 100,000 Population By Town is less than five or less than five reported cases.
  • The Yellow category is defined as when the Average Daily Rate of COVID-19 Cases Among Persons Living in Community Settings per 100,000 Population By Town is between five and nine reported cases.
  • The Orange category is defined as when the Average Daily Rate of COVID-19 Cases Among Persons Living in Community Settings per 100,000 Population By Town is between 10 and 14.
  • The Red category is defined as when the Average Daily Rate of COVID-19 Cases Among Persons Living in Community Settings per 100,000 Population By Town exceeds 15.

In all cases, this rate does not include cases or tests among residents of nursing home, assisted living, or correctional facilities.

The map below is from July 22, when two towns, Franklin and Salem, were in the Red Zone (indicating the highest rate of COVID-19 new cases), which is up one from the previous week, and Andover remained in the (second highest rate) Orange Zone (down from two towns last week.)

Eight towns were in the Yellow Zone (indicating the lowest but one rate of COVID-19 new cases), which is up from two last week. They were Clinton, East Hampton, Manchester, Newington, Stonington, Westbrook, Windsor and Windsor Locks.

This map, updated July 22, 2021 shows the average daily rate of new cases of COVID-19 by town during the past two weeks. Both Lyme and Old Lyme are still in the (lowest) Gray Zone.

The map below is from July 15, when one town, Franklin, was in the Red Zone (indicating the highest rate of COVID-19 new cases) and another two, Salem and Andover, were in the (second highest rate) Orange Zone. New Hartford and Griswold were in the Yellow Zone (indicating the lowest but one rate of COVID-19 new cases.)

This map, updated July 15, 2021 shows the average daily rate of new cases of COVID-19 by town during the past two weeks. Both Lyme and Old Lyme are still in the (lowest) Gray Zone.

The map below is from July 8, when New Hartford was the sole town in the Yellow Zone.

This map, updated July 8, 2021 shows the average daily rate of new cases of COVID-19 by town during the past two weeks. Both Lyme and Old Lyme are still in the (lowest) Gray Zone.

The map below is from July 1, when Marlborough and Prospect were in the Yellow Zone.

This map, updated July 1, 2021 shows the average daily rate of new cases of COVID-19 by town during the past two weeks. Both Lyme and Old Lyme are still in the (lowest) Gray Zone.

The map below is from June 24, when Somers, Prospect and Bolton were in the Yellow Zone.

This map, updated June 24, shows the average daily rate of new cases of COVID-19 by town during the past two weeks. Both Lyme and Old Lyme are still in the (lowest) Gray Zone.

This is the June 17 map, when just one town, Bolton, was in the Yellow Zone.

This map, updated June 17, shows the average daily rate of new cases of COVID-19 by town during the past two weeks. Both Lyme and Old Lyme are still in the (lowest) Gray Zone.

For comparison, the map below is from June 3 and shows one town, Waterbury, in the Orange Zone and 21 towns in the Yellow Zone, down from 48 the previous week. The towns in the Yellow Zone were: Ansonia, Beacon Falls, Bloomfield, Brooklyn, Coventry, Cromwell, Derby, East Hartford, East Haven, Granby, Hamden, Hartford, Manchester, New Britain, New Haven, New London, Putnam, Rocky Hill, Shelton, Waterford and Windsor.

This map, updated June 3, shows the average daily rate of new cases of COVID-19 by town during the previous two weeks. Both Lyme and Old Lyme are in the (lowest) Gray Zone.

Below is the map from May 27 that showed one town in the Red Zone, Putnam, and 10 towns in the Orange Zone.

This map, updated May 27, shows the average daily rate of new cases of COVID-19 by town during the past two weeks. Both Lyme and Old Lyme were still in the (lowest) Gray Zone.

Compare the maps above with the one we published Dec. 18, 2020 to see the remarkable progress that has been made with controlling the spread of the virus through expansion of vaccination rates and improved mitigation strategies.

Map of Connecticut dated Dec. 17, 2020 showing both Lyme and Old Lyme now in the CT DPH-identified ‘Red Zone.’ This is defined as when the Average Daily Rate of COVID-19 Cases Among Persons Living in Community Settings per 100,000 Population By Town is over 15.

Vaccination rates in Lyme and Old Lyme are encouraging with 82.47 percent of the population in Lyme having received at least one dose of the COVID-19 vaccine and the equivalent number for Old Lyme being 74.17. percent.

Percentages for the fully vaccinated are 79.23 for Lyme and 70.79 for Old Lyme.

These rates remain among the higher percentages in the state.

Information regarding vaccination opportunities and other relevant information can be found at https://llhd.org/coronavirus-covid-19-situation/covid-19-vaccine/

The following link provides centralized access to Connecticut COVID data: https://data.ct.gov/stories/s/COVID-19-data/wa3g-tfvc/

After 10 Years Service, Nosal Explains Her Decision Not to Seek Reelection to Old Lyme BOS; Will Run For Zoning Commission

“It has been a privilege to serve the residents of Old Lyme as a Selectwoman for the past 10 years.” (Mary Jo Nosal)

Old Lyme Selectwoman Mary Jo Nosal is not seeking reelection. (File photo)

OLD LYME — Mary Jo Nosal has served as Old Lyme Selectman for the past 10 years, but when the Old Lyme Democratic Town Committee (OL DTC) announced their slate of candidates for the upcoming November election, her name was against neither the position of Selectman nor First Selectman.

Asked by phone why that was the case, she said simply, “It’s time after 10 years for new ideas.”

She added, “It has been a privilege to serve the residents of Old Lyme as a Selectwoman [for that time.]”

Additionally in an e-mailed statement, Nosal said, “I chose not to run for the Board of Selectmen as I believe it is time for … other qualified individuals to serve.”
Commenting on the OL DTC’s selection of Martha Shoemaker  and Jim Lampos for the top spots, Nosal stated, “I support the exceptionally qualified and enthusiastic candidates endorsed by the OL DTC. Martha Shoemaker for First Selectman and Jim Lampos for the Board of Selectmen are experienced, eminently qualified and know Old Lyme. They will work hard for the community.”
Although not running for the board of selectmen, Nosal’s name is on the slate as a candidate for the Old Lyme Zoning Commission. Asked about that decision, she explained, “I am ready, if elected, to focus my energies on the Zoning Commission.”
Noting in her statement that there is, “Important work facing the Old Lyme Zoning Commission,” she said, “I believe my experience will bring value to the Zoning Commission.”