Halls Road Improvement Committee Seeks Letters of Support for Project to Use in Village District Rezoning Application

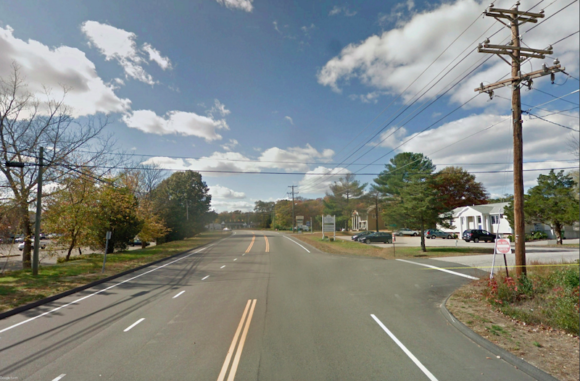
The view looking up Halls Road today. The HRIC Master Plan Report offers a vision for its future.

OLD LYME — The Halls Road Improvement Committee (HRIC) is asking local residents and interested parties, who support the Halls Road Master Plan Report compiled by the BSC Group, to indicate their support by submitting a letter to Town Hall.

Edie Twining, HRIC Chair, explains that the committee is hoping that a substantial show of support will be generated in this way. She says, “This will then be used for both the HRIC rezoning application to create a Halls Road Village District as well as in upcoming HRIC grant applications.”

A sample letter is printed below, which can be printed, signed, and mailed to Town Hall at the address shown. Supporters are naturally welcome to compose their own letters and mail them to the same address.

Twining notes, “The HRIC has also met with many local organizations and businesses to walk through the Master Plan findings and answer questions one-on-one. Committee members have enjoyed great support from everyone they have met with.”

She adds, “The committee is ready and willing to continue this presentation process for any groups looking for more information.”

Editor’s Note: Here is the sample letter:

Support for Halls Road Master Plan

Halls Road is our town’s main retail/commercial center. Going forward, it should be developed with the aim of making it look, feel, and function as a pedestrian-friendly town center. It should have safe and attractive pedestrian and bicycle connections with the historic town center and ‘Arts District’ on Lyme Street. Halls Road in the future should more nearly resemble the small-town, mixed-use neighborhood that Lyme Street was before 1960.

The limited build-able land along Halls Road should be developed in such a way as to serve the particular needs of Old Lyme. Under the current commercial-only zoning, Halls Road’s location along I-95 means new investment is almost entirely limited to either chain stores (viewing Old Lyme as no more than Exit 70), or truck stops serving highway traffic. This is not what we want for Old Lyme’s future.

The current housing stock in Old Lyme is overwhelmingly (over 92%) of one kind: a single-family home on its own lot. Halls Road is an appropriate location in which to add other, smaller-scale types of market-rate housing, such as an apartment above a shop, or a condominium in a town house. These options are particularly attractive to the younger and older cohorts of current (or prospective) Old Lyme residents.

Allowing this kind of mixed-use development along Halls Road has other important advantages for the town. First: a living neighborhood with foot traffic is far better for retail trade, and helps retail businesses resist the growing competition of online commerce. A mixed-use neighborhood along Halls Road improves the chances that Old Lyme will continue to have the convenience of in-person retail shops in 2050. Second, because these housing types are currently scarce in Old Lyme, pent-up demand makes such developments highly attractive to investors. We believe developers would be willing to build some new retail and office space if it were a part of a larger mixed-use (residential and commercial) area. New investment along Halls Road will also increase the town’s tax base and revenues.

The Halls Road Master Plan Report, prepared by BSC, is a road map to these changes.

It proposes the Town design and build (with aid from available grants) a safe and attractive pedestrian and cyclist route from Lyme Street to the heart of the Halls Road district, and to make other significant improvements for the safety of walkers and bikers in the area along Halls Road.

It also proposes the creation of a Halls Road Village District that would allow mixed use to achieve the goals mentioned above. It would also allow the town to establish Design Guidelines to help ensure the “look and feel” of new development along Halls Road is more in keeping with that of historic Lyme Street.

I/We support the Town’s initiative in creating the Master Plan, and look forward to a Halls Road that will become a new, mixed-use, pedestrian-friendly Town Center for Old Lyme in the Mid-21st Century.

Name____________________________________________________________________

Signed_________________________________________________      Date_____________
Organization_______________________________________________________________
 
Please return by mail to: HRIC chair Edie Twining c/o Memorial Town Hall, 52 Lyme St. Old Lyme CT 06371

Sept. 16 COVID-19 Update: Lyme, Old Lyme Stay Red; Four New Cases Take Old Lyme’s Cumulative Total to 411, Lyme Holds at 129

This map, updated Sept. 16, 2021 shows the average daily rate of new cases of COVID-19 by town during the past two weeks. Both Lyme and Old Lyme remain in the Red (highest) Zone for average daily case rates. Only cases among persons living in community settings are included in this map; the map does not include cases among people who reside in nursing home, assisted living, or correctional facilities.) Map: Ver 12.1.2020 Source: CT Department of Public Health Get the data Created with Datawrapper. Details in italics are the same for each of the maps included in this article.

LYME/OLD LYME — The Daily Data Report for Connecticut issued Thursday, Sept. 16, by the Connecticut Department of Public Health  (CT-DPH) for data as at 8:30 p.m. Wednesday, Sept. 15, has more distressing data for Lyme and Old Lyme.

It shows that both towns remain in the Red (highest) Zone for the average daily rate of new cases of COVID-19. This is the second week in succession that both towns have found themselves in the Red Zone. See detailed description of the zones in italics below.

Lyme now has an Average Daily Case Rate of 43.2 while Old Lyme’s is 30.3. A rate over 15 places a town in the Red Zone.

Connecticut’s daily positivity rate now stands at 2.93 percent, down from 3.36 on Thursday last week.

Despite this poor situation locally, statewide, the latest average daily rate of new cases of COVID-19 by town during the past two weeks (see map above) has remained pretty constant over the past week with 84 towns now in the Red Zone, which is only one higher than last week’s total of 83.  On Sept. 2, the total was 91 so the trend is undoubtedly downward although it is still up significantly from the 39 reported on Aug. 12.

Old Lyme reported four new, confirmed COVID-19 cases Thursday, Sept.16, since the previous CT DPH report issued Wednesday, Sept. 15. This means Old Lyme’s cumulative total of confirmed cases rises to 411, while Lyme reported no new cases and therefore kept its cumulative total at 129.

On Aug. 26, the cumulative number of cases in Old Lyme was 372 meaning 39 cases have been reported since that date, while 12 have also been confirmed in Lyme during the same period. Lyme-Old Lyme Schools re-opened to students Aug. 26.

  • The Gray category is defined as when the Average Daily Rate of COVID-19 Cases Among Persons Living in Community Settings per 100,000 Population By Town is less than five or less than five reported cases.
  • The Yellow category is defined as when the Average Daily Rate of COVID-19 Cases Among Persons Living in Community Settings per 100,000 Population By Town is between five and nine reported cases.
  • The Orange category is defined as when the Average Daily Rate of COVID-19 Cases Among Persons Living in Community Settings per 100,000 Population By Town is between 10 and 14.
  • The Red category is defined as when the Average Daily Rate of COVID-19 Cases Among Persons Living in Community Settings per 100,000 Population By Town exceeds 15.
    In all cases, this rate does not include cases or tests among residents of nursing home, assisted living, or correctional facilities.

Weekly Report from Ledge Light Health District (LLHD)

Jennifer Muggeo, MPH, who is currently LLHD Deputy Director/Acting Director while Stephen Mansfield is on vacation,  prefaced the weekly LLHD report sent out today, Sept. 17, with these words, “This week’s numbers reflect outbreaks at both a daycare and an institution of higher education and outbreaks within households and congregate living situations as well as transmission associated with social gatherings.”

She added, “We strongly advise everyone to wear masks indoors in public settings, regardless of vaccination status”

Muggeo noted in addition, “LLHD encourages everyone 12 and older to get vaccinated. Information regarding vaccination opportunities and other relevant information can be found at Ledge Light Health District | Promoting Healthy Communities (llhd.org)

The nine towns included in the LLHD show the majority — including Lyme and Old Lyme — in the Red Zone. Only Stonington, East Lyme and Groton are in the Orange (second highest) Zone.

Vaccination Rates

Vaccination rates in Lyme and Old Lyme are encouraging with 84.8 percent of the population in Lyme having received at least one dose of the COVID-19 vaccine and the equivalent number for Old Lyme being 76.9 percent.

Percentages for the fully vaccinated are 80.9 for Lyme and 73.4 for Old Lyme.

These rates remain among the higher percentages in the state.

COVID-19 Cases Over Time: Dec. 2020-Aug. 2021

The following maps show has the picture of COVID-19 cases has gone from an almost totally red map back in Dec. 2020 to an almost all-gray map on June 17, 2021 and then back to a map with all colors represented in substantial number again.

Sept. 9
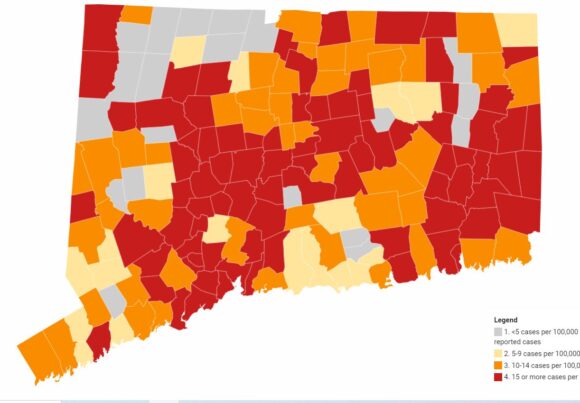
This map, updated Sept. 9, 2021 shows the average daily rate of new cases of COVID-19 by town during the past two weeks. Both Lyme and Old Lyme have moved into the Red (highest) Zone.

The Daily Data Report issued Thursday, Sept. 9, by the Connecticut Department of Health (CT DPH) showed the following:

These 47 towns were in the Orange (second highest) Zone: Avon, Bethlehem, Bloomfield, Branford, Bridgeport, Brookfield, Burlington, Colchester, Danbury, Durham, East Haddam, East Lyme, East Windsor, Easton, Ellington, Fairfield, Farmington, Greenwich, Groton, Hamden, Killingly, Killingworth, Lebanon, New Milford, Newington, North Canaan, Old Saybrook, Pomfret, Portland, Salem, Shelton, Sherman, Simsbury, Somers, South Windsor, Southbury, Stamford, Stonington, Suffield, Tolland, Washington, West Hartford, Wethersfield, Willington, Wilton, Windsor Locks and Woodstock.

These 19 towns were in the Yellow (second lowest) Zone: Bethany, Bethel, Canton, Clinton, Coventry, Darien, Essex, Guilford, Haddam, Madison, Mansfield, New Canaan, Redding, Ridgefield, Thompson, Westbrook, Westport, Winchester and Woodbury.

These 20 towns were in the Gray (lowest) Zone: Andover, Barkhamsted, Bridgewater, Canaan, Chester, Colebrook, Cornwall, Deep River, Eastford, Goshen, Granby, Hampton, Hartland, Kent, Middlefield, Morris, Norfolk, Roxbury, Scotland and Weston.

All other towns in the state, including Lyme and Old Lyme, were in the Red (highest) Zone.

Sept. 2
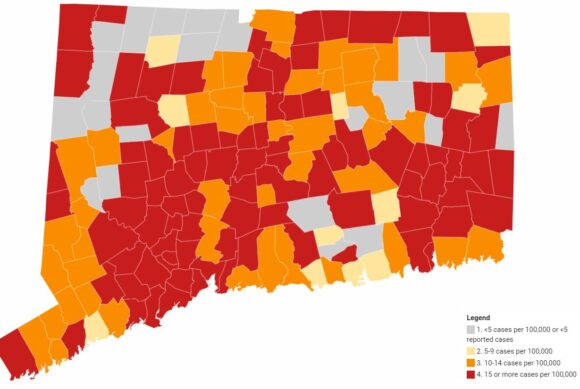
This map, updated Sept. 2, 2021 shows the average daily rate of new cases of COVID-19 by town during the past two weeks. Lyme is still in the (lowest) Gray Zone, while Old Lyme has moved back down into the Yellow Zone.

The map above is from Sept. 2 when 91 towns were in the Red Zone, which is down one from 92 a week ago on Aug. 26, but still up significantly from 73  on Aug. 19, and 39 on Aug. 12.

Connecticut’s seven-day positivity rate stood at 3.36 percent, down from 3.52 last week.

Old Lyme had fallen to the Yellow (second lowest) Zone along with 10 other towns. This total of 11 towns is unchanged from last week, when Old Lyme was in the Orange Zone.

Lyme was in the Gray (lowest) Zone. This was the 24th straight week for Lyme in the Gray Zone. Again, this total of 20 towns in the Gray Zone was unchanged from last week.

Forty-seven towns were in the Orange (second highest) Zone.

Aug. 26
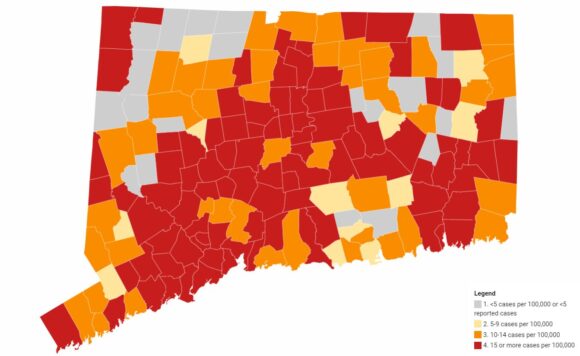
This map, updated Aug. 26, 2021 shows the average daily rate of new cases of COVID-19 by town during the past two weeks. Lyme is still in the (lowest) Gray Zone, while Old Lyme has moved back down into the Yellow Zone.

The map above is from Aug. 26, when Old Lyme was in the Orange (second highest case rate) Zone with a daily case rate per 100,000 of 10.8. Other towns in the Orange Zone, which are within the Ledge Light Health District (LLHD), were East Lyme (12.4), North Stonington (13.7) and Stonington (14.2).

Towns in the Red Zone in the LLHD were Groton – Town & City (15.6), New London (31.1), and Ledyard (25.9). Locally, Norwich, Montville and Waterford were also categorized as red, but they are not in the LLHD.

Eleven Connecticut towns were in the Yellow (second lowest) Zone down from 20the previous week. Locally, these included Deep River, Old Saybrook and Haddam.

The remaining 20 towns in the state, including Lyme, were in the Gray (lowest rate) Zone. This was the 23rd straight week for Lyme in the Gray Zone.

Aug. 19
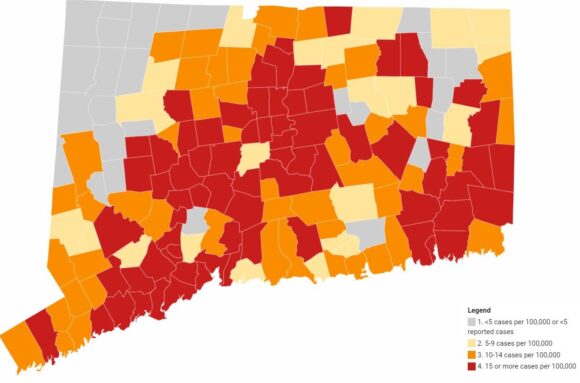
This map, updated Aug. 19, 2021 shows the average daily rate of new cases of COVID-19 by town during the past two weeks. Lyme is still in the (lowest) Gray Zone, while Old Lyme has moved back into the Orange Zone.

The map above is from Aug. 19 when Old Lyme was back in the Orange (second highest case rate) Zone with a two-week case rate per 100,000 of 11.7. Other towns in the Orange Zone, which are within the Ledge Light Health District (LLHD), were East Lyme (10.4) and Stonington (12.7).

Almost 50 towns in the state remained in the Orange Zone, which was around the same number as the previous week including non-LLHD members Westbrook, Old Saybrook, Chester, and Salem locally.

Towns in the Red Zone in the LLHD were Groton – Town & City (15.6), New London (26.3), Ledyard (21.0), and North Stonington (17.9). Locally, Norwich and Waterford were also categorized as red, but they are not in the LLHD.

Less than 20 Connecticut towns were in the Yellow (second lowest) Zone down from 40 the previous week. Locally, these included including Deep River, Essex and East Haddam.

The remaining 20 towns in the state, including Lyme, are in the Gray (lowest rate) Zone. This was the 22nd straight week for Lyme in the Gray Zone.

Aug. 12

The map below is from Aug. 12 and shows that Old Lyme had fallen out of the Orange (second highest case rate) Zone into the Yellow (second lowest) Zone — but only by a fraction. Old Lyme’s two-week case rate per 100,000 was 9.8 — if it were 10.0, then it would have still been in the Orange Zone.

Towns in the Red Zone, which are within the Ledge Light Health District (LLHD), included New London, Ledyard, Stonington and North Stonington. Locally, Norwich and Waterford were also categorized as red, but they are not in the LLHD.

Other towns in the red category included Ansonia, Beacon Falls, Cheshire, East Haven, Easton, Hartford, Meriden, Middletown, New Britain, New Haven, North Branford, North Haven, Norwich, Plymouth, Stamford, Thomaston and Waterbury. At least three of these towns — Easton, Hartford and Thomaston — were in the Red Zone for the second consecutive week.

Almost 50 towns were in the Orange (second highest case rate) Zone — up from 33 the previous week — including Westbrook and Salem locally.

Old Lyme joined the Yellow (second lowest) Zone along with around 40 other Connecticut towns, including Old Saybrook, East Lyme, and Essex.

All remaining towns in the state, including Lyme, along with Deep River and Chester, were in the Gray (lowest rate) Zone. This was the 21st straight week for Lyme in the Gray Zone.
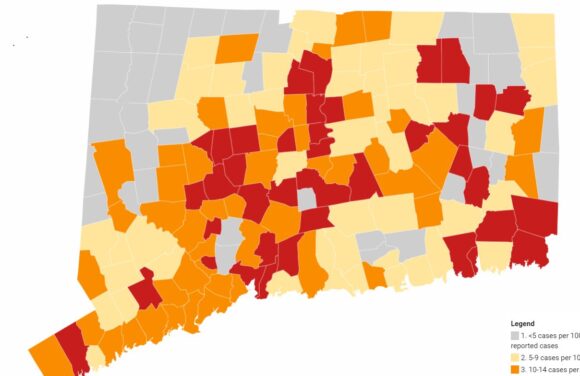
This map, updated Aug. 12, 2021 shows the average daily rate of new cases of COVID-19 by town during the past two weeks. Lyme is still in the (lowest) Gray Zone, but Old Lyme has moved into the Orange Zone.

Aug. 5

The map below is from Aug. 5 when six towns were in the Red (highest case rate) Zone (the previous week’s number was four) and 33 in the Orange (second highest case rate) Zone — the previous week’s number was four.

The towns in the Red Zone were East Hampton, Easton, Hampton, Hartford, Hartland, North Stonington*, and Thomaston.

There were 33 towns in the Orange Zone including Old Lyme, Waterford, New London, Groton, Ledyard and Stonington, all of which are in the Ledge Light Health District, as are the towns denoted with an * in the other zones.

East Lyme* had reentered the Yellow (second lowest) Zone along with more than 50 other Connecticut towns.

All remaining towns in the state, including Lyme*, were in the Gray (lowest rate) Zone. This was the 20th straight week for Lyme in the Gray Zone.
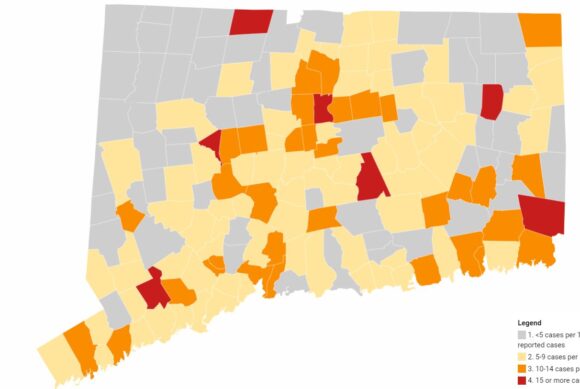
This map, updated Aug. 5, 2021 shows the average daily rate of new cases of COVID-19 by town during the past two weeks. Lyme is still in the (lowest) Gray Zone, but Old Lyme has moved into the Orange Zone.

July 29

The map below is from July 29, when four towns were in the Red Zone –Harland, Salem, Bozrah and Sprague — and four towns were in the Orange Zone — Easton, East Hampton, Ledyard and Thompson.

Old Lyme had reentered the Yellow (second lowest) Zone along with more than 50 other Connecticut towns. All remaining towns in the state, including Lyme, were in the Gray (lowest rate) Zone. This was the 19th straight week for Lyme in the Gray Zone.
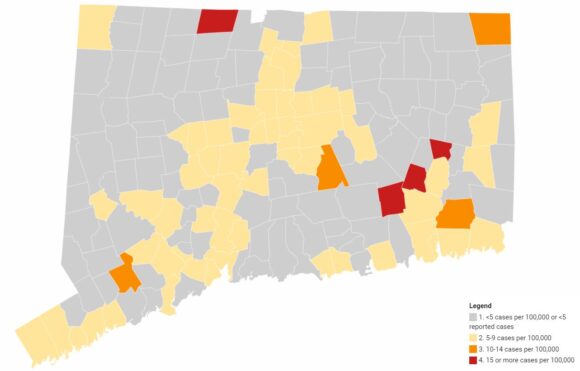
This map, updated July 29, 2021 shows the average daily rate of new cases of COVID-19 by town during the past two weeks. Lyme is still in the (lowest) Gray Zone, but Old Lyme has moved into the Yellow Zone.

July 22

The map below is from July 22, when two towns, Franklin and Salem, were in the Red Zone (indicating the highest rate of COVID-19 new cases), which is up one from the previous week, and Andover remained in the (second highest rate) Orange Zone (down from two towns last week.)

Eight towns were in the Yellow Zone (indicating the lowest but one rate of COVID-19 new cases), which is up from two last week. They were Clinton, East Hampton, Manchester, Newington, Stonington, Westbrook, Windsor and Windsor Locks.

This map, updated July 22, 2021 shows the average daily rate of new cases of COVID-19 by town during the past two weeks. Both Lyme and Old Lyme are still in the (lowest) Gray Zone.

July 15

The map below is from July 15, when one town, Franklin, was in the Red Zone (indicating the highest rate of COVID-19 new cases) and another two, Salem and Andover, were in the (second highest rate) Orange Zone. New Hartford and Griswold were in the Yellow Zone (indicating the lowest but one rate of COVID-19 new cases.)

This map, updated July 15, 2021 shows the average daily rate of new cases of COVID-19 by town during the past two weeks. Both Lyme and Old Lyme are still in the (lowest) Gray Zone.

The map below is from July 8, when New Hartford was the sole town in the Yellow Zone.

This map, updated July 8, 2021 shows the average daily rate of new cases of COVID-19 by town during the past two weeks. Both Lyme and Old Lyme are still in the (lowest) Gray Zone.

The map below is from July 1, when Marlborough and Prospect were in the Yellow Zone.

This map, updated July 1, 2021 shows the average daily rate of new cases of COVID-19 by town during the past two weeks. Both Lyme and Old Lyme are still in the (lowest) Gray Zone.

The map below is from June 24, when Somers, Prospect and Bolton were in the Yellow Zone.

This map, updated June 24, shows the average daily rate of new cases of COVID-19 by town during the past two weeks. Both Lyme and Old Lyme are still in the (lowest) Gray Zone.

This is the June 17 map, when just one town, Bolton, was in the Yellow Zone.

This map, updated June 17, shows the average daily rate of new cases of COVID-19 by town during the past two weeks. Both Lyme and Old Lyme are still in the (lowest) Gray Zone.

For comparison, the map below is from June 3 and shows one town, Waterbury, in the Orange Zone and 21 towns in the Yellow Zone, down from 48 the previous week. The towns in the Yellow Zone were: Ansonia, Beacon Falls, Bloomfield, Brooklyn, Coventry, Cromwell, Derby, East Hartford, East Haven, Granby, Hamden, Hartford, Manchester, New Britain, New Haven, New London, Putnam, Rocky Hill, Shelton, Waterford and Windsor.

This map, updated June 3, shows the average daily rate of new cases of COVID-19 by town during the previous two weeks. Both Lyme and Old Lyme are in the (lowest) Gray Zone.

Below is the map from May 27 that showed one town in the Red Zone, Putnam, and 10 towns in the Orange Zone.

This map, updated May 27, shows the average daily rate of new cases of COVID-19 by town during the past two weeks. Both Lyme and Old Lyme were still in the (lowest) Gray Zone.

Compare the maps above with the one we published Dec. 18, 2020 to see the remarkable progress that has been made with controlling the spread of the virus through expansion of vaccination rates and improved mitigation strategies.
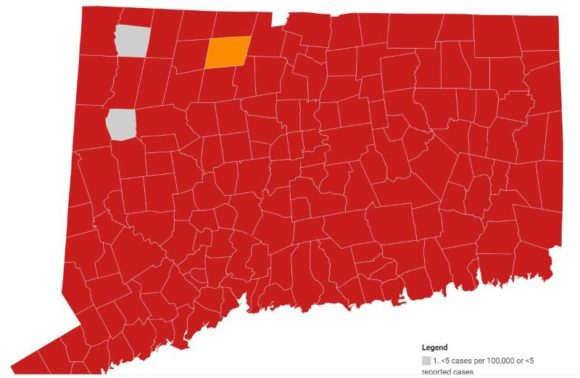
Map of Connecticut dated Dec. 17, 2020 showing both Lyme and Old Lyme now in the CT DPH-identified ‘Red Zone.’ This is defined as when the Average Daily Rate of COVID-19 Cases Among Persons Living in Community Settings per 100,000 Population By Town is over 15.

The following link provides centralized access to Connecticut COVID data: https://data.ct.gov/stories/s/COVID-19-data/wa3g-tfvc/

Sept. 14 COVID-19 Update: Three New Cases Take Old Lyme’s Cumulative Total to 406, Lyme Holds at 129

Photo by CDC on Unsplash.

LYME/OLD LYME — The Daily Data Report issued Tuesday, Sept. 14, at 4 p.m. by the Connecticut Department of Health shows a further increase in COVID-19 case numbers in Old Lyme compared with Monday’s report. No new cases were reported in Lyme over the same 24-hour period.

Old Lyme’s cumulative total of confirmed cases rose by three over the previous reporting day, Sept. 13, from 403 to 406.

Lyme held steady, meanwhile, at a cumulative total of 129 cases.

Old Lyme’s cumulative case total stood at 369 on Aug. 20, meaning there have been 37 new cases since that date just over three weeks ago.

The next Connecticut Daily Data Report will be issued Wednesday, Sept. 15, around 4 p.m. Reports are not issued on Public Holidays, Saturdays or Sundays.

COVID-19 Cases in Lyme-Old Lyme Schools

This is the latest information that we have with the most recent cases first — there may have been further updates of which we are unaware.

On Monday, Sept. 13, a positive case of COVID-19 impacting Lyme-Old Lyme Middle School, which had been reported the previous day, was announced.

On Wednesday, Sept. 1,  a positive case of COVID-19 impacting Mile Creek School was announced.

On Tuesday, Aug. 31, Neviaser informed the school community that late on Monday, Aug. 30, a positive case of COVID-19 impacting Lyme-Old Lyme High School had been reported.

On Saturday, Aug. 28, Lyme-Old Lyme Schools Superintendent Ian Neviaser informed the school community that late on Friday, Aug. 27, a positive case of COVID-19 impacting Lyme School had been reported.

In all cases, contact tracing was completed and those individuals who needed to quarantine were notified. They will be able to return to school following their quarantine period. All other students and staff will continue to attend school as scheduled.

Fatalities Due to COVID-19 in Lyme, Old Lyme

There is no change in the number of fatalities reported in either Lyme (0) or Old Lyme (3).

The first two fatalities from Old Lyme, which were reported in 2020, were a 61-year-old female and an 82-year-old male. Details of the third, which was reported in 2021, have not been made available.

Visit this link for our Sept. 9 update, which includes statewide data.

Sept. 13 COVID-19 Update: Two New Cases Apiece Take Old Lyme’s Cumulative Total to 403, Lyme’s Total to 129

Photo by Fusion Medical Animation on Unsplash.

LYME/OLD LYME — The Daily Data Report issued Monday, Sept. 13, at 4 p.m. by the Connecticut Department of Health shows further increases in COVID-19 case numbers in both Lyme and Old Lyme over the weekend. Reports are not issued on Public Holidays, Saturdays or Sundays.

Old Lyme’s cumulative total of confirmed cases rose by two over the previous reporting day, Sept. 10, from 401 to 403. Sept. 10 totals were up one to 401 for Old Lyme and steady at 127 for Lyme from the Sept. 9 numbers.

Lyme also recorded an increase of two in its cumulative case total from 127 to 129.

Old Lyme’s cumulative case total stood at 369 on Aug. 20, meaning there have been 34 new cases since that date just over two weeks ago.

The next Connecticut Daily Data Report will be issued Tuesday, Sept. 14, around 4 p.m.

COVID-19 Cases in Lyme-Old Lyme Schools

This is the latest information that we have with the most recent cases first — there may have been further updates of which we are unaware.

On Monday, Sept. 13, a positive case of COVID-19 impacting Lyme-Old Lyme Middle School, which had been reported the previous day, was announced.

On Wednesday, Sept. 1,  a positive case of COVID-19 impacting Mile Creek School was announced.

On Tuesday, Aug. 31, Neviaser informed the school community that late on Monday, Aug. 30, a positive case of COVID-19 impacting Lyme-Old Lyme High School had been reported.

On Saturday, Aug. 28, Lyme-Old Lyme Schools Superintendent Ian Neviaser informed the school community that late on Friday, Aug. 27, a positive case of COVID-19 impacting Lyme School had been reported.

In all cases, contact tracing was completed and those individuals who needed to quarantine were notified. They will be able to return to school following their quarantine period. All other students and staff will continue to attend school as scheduled.

Fatalities Due to COVID-19 in Lyme, Old Lyme

There is no change in the number of fatalities reported in either Lyme (0) or Old Lyme (3).

The first two fatalities from Old Lyme, which were reported in 2020, were a 61-year-old female and an 82-year-old male. Details of the third, which was reported in 2021, have not been made available.

Visit this link for our Sept. 9 update, which includes statewide data.

Sept. 9 COVID-19 Update: Both Lyme, Old Lyme in Red Zone; OL Records 400th COVID-19 Case, Lyme Rises to 127 Cumulative Total

This map, updated Sept. 9, 2021 shows the average daily rate of new cases of COVID-19 by town during the past two weeks. Both Lyme and Old Lyme have moved into the Red (highest) Zone. Only cases among persons living in community settings are included in this map; the map does not include cases among people who reside in nursing home, assisted living, or correctional facilities.) Map: Ver 12.1.2020 Source: CT Department of Public Health Get the data Created with Datawrapper. Details in italics are the same for each of the maps included in this article.

LYME/OLD LYME — The Daily Data Report for Connecticut issued Thursday, Sept. 9, by the Connecticut Department of Public Health  (CT-DPH) for data as at 8:30 p.m. Wednesday, Sept. 8, has some very worrying data for Lyme and Old Lyme.

It shows that both towns have moved into the Red (highest) Zone for the average daily rate of new cases of COVID-19. We believe this is the first time since March 2021 that Lyme has been in the Red Zone and the equivalent date for Old Lyme is February 2021.

Last week, Old Lyme was in the Yellow (second lowest) Zone, and Lyme remained in the Gray (lowest) Zone for the 24th consecutive week.

Despite this distressing data locally, statewide, the latest average daily rate of new cases of COVID-19 by town during the past two weeks (see map above) has improved over the past week with 83 towns now in the Red Zone, which is down eight from 91 a week ago on Sept. 2, and 92 the week before on Aug. 26. but still up significantly from 39 on Aug. 12.

Old Lyme reported two new, confirmed COVID-19 cases since the previous CT DPH report issued Wednesday, Sept. 8. This means Old Lyme’s cumulative total of confirmed cases rises to 400, while Lyme recorded one new case taking its cumulative total to 127.

Lyme now has an Average Daily Case Rate of 27.8 while Old Lyme’s is 23.5. A rate over 15 places a town in the Red Zone.

On Aug. 26, the cumulative number of cases in Old Lyme was 372 meaning 28 cases have been reported since that date, while 12 have also been confirmed in Lyme during the same period. Lyme-Old Lyme Schools re-opened to students Aug. 26.

Two-Week Case Rate Zones: Old Lyme and Lyme Both Now Red

See detailed description of the zones in italics below.

The Daily Data Report issued Thursday, Sept. 9, by the Connecticut Department of Health (CT DPH) shows the following:

These 47 towns are in the Orange (second highest) Zone: Avon, Bethlehem, Bloomfield, Branford, Bridgeport, Brookfield, Burlington, Colchester, Danbury, Durham, East Haddam, East Lyme, East Windsor, Easton, Ellington, Fairfield, Farmington, Greenwich, Groton, Hamden, Killingly, Killingworth, Lebanon, New Milford, Newington, North Canaan, Old Saybrook, Pomfret, Portland, Salem, Shelton, Sherman, Simsbury, Somers, South Windsor, Southbury, Stamford, Stonington, Suffield, Tolland, Washington, West Hartford, Wethersfield, Willington, Wilton, Windsor Locks and Woodstock.

These 19 towns are in the Yellow (second lowest) Zone: Bethany, Bethel, Canton, Clinton, Coventry, Darien, Essex, Guilford, Haddam, Madison, Mansfield, New Canaan, Redding, Ridgefield, Thompson, Westbrook, Westport, Winchester and Woodbury.

These 20 towns are in the Gray (lowest) Zone: Andover, Barkhamsted, Bridgewater, Canaan, Chester, Colebrook, Cornwall, Deep River, Eastford, Goshen, Granby, Hampton, Hartland, Kent, Middlefield, Morris, Norfolk, Roxbury, Scotland and Weston.

All other towns in the state, including Lyme and Old Lyme, are in the Red (highest) Zone.

Connecticut’s daily positivity rate now stands at 2.93 percent, down from 3.36 last week.

  • The Gray category is defined as when the Average Daily Rate of COVID-19 Cases Among Persons Living in Community Settings per 100,000 Population By Town is less than five or less than five reported cases.
  • The Yellow category is defined as when the Average Daily Rate of COVID-19 Cases Among Persons Living in Community Settings per 100,000 Population By Town is between five and nine reported cases.
  • The Orange category is defined as when the Average Daily Rate of COVID-19 Cases Among Persons Living in Community Settings per 100,000 Population By Town is between 10 and 14.
  • The Red category is defined as when the Average Daily Rate of COVID-19 Cases Among Persons Living in Community Settings per 100,000 Population By Town exceeds 15.
    In all cases, this rate does not include cases or tests among residents of nursing home, assisted living, or correctional facilities.

Weekly Report from Ledge Light Health District (LLHD)

Stephen Mansfield, LLHD Director of Health, prefaced the weekly LLHD report sent out yesterday, Aug. 26, with these words, “Although the number of new cases has leveled off this week [in the LLHD coverage area], it is imperative that we remain diligent in our mitigation strategies.”

He added, “We strongly advise everyone to wear masks indoors in public settings, regardless of vaccination status”

Mansfield noted in addition, “LLHD encourages everyone 12 and older to get vaccinated. Information regarding vaccination opportunities and other relevant information can be found at Ledge Light Health District | Promoting Healthy Communities (llhd.org)

Vaccination Rates

Vaccination rates in Lyme and Old Lyme are encouraging with 84.33 percent of the population in Lyme having received at least one dose of the COVID-19 vaccine and the equivalent number for Old Lyme being 76.81 percent.

Percentages for the fully vaccinated are 80.66 for Lyme and 73.06 for Old Lyme.

These rates remain among the higher percentages in the state.

COVID-19 Cases Over Time: Dec. 2020-Aug. 2021

The following maps show has the picture of COVID-19 cases has gone from an almost totally red map back in Dec. 2020 to an almost all-gray map on June 17, 2021 and then back to a map with all colors represented in substantial number again.

Sept. 2

This map, updated Sept. 2, 2021 shows the average daily rate of new cases of COVID-19 by town during the past two weeks. Lyme is still in the (lowest) Gray Zone, while Old Lyme has moved back down into the Yellow Zone.

The map above is from Sept. 2 when 91 towns were in the Red Zone, which is down one from 92 a week ago on Aug. 26, but still up significantly from 73  on Aug. 19, and 39 on Aug. 12.

Connecticut’s seven-day positivity rate stood at 3.36 percent, down from 3.52 last week.

Old Lyme had fallen to the Yellow (second lowest) Zone along with 10 other towns. This total of 11 towns is unchanged from last week, when Old Lyme was in the Orange Zone.

Lyme was in the Gray (lowest) Zone. This was the 24th straight week for Lyme in the Gray Zone. Again, this total of 20 towns in the Gray Zone was unchanged from last week.

Forty-seven towns were in the Orange (second highest) Zone.

Aug. 26

This map, updated Aug. 26, 2021 shows the average daily rate of new cases of COVID-19 by town during the past two weeks. Lyme is still in the (lowest) Gray Zone, while Old Lyme has moved back down into the Yellow Zone.

The map above is from Aug. 26, when Old Lyme was in the Orange (second highest case rate) Zone with a daily case rate per 100,000 of 10.8. Other towns in the Orange Zone, which are within the Ledge Light Health District (LLHD), were East Lyme (12.4), North Stonington (13.7) and Stonington (14.2).

Towns in the Red Zone in the LLHD were Groton – Town & City (15.6), New London (31.1), and Ledyard (25.9). Locally, Norwich, Montville and Waterford were also categorized as red, but they are not in the LLHD.

Eleven Connecticut towns were in the Yellow (second lowest) Zone down from 20the previous week. Locally, these included Deep River, Old Saybrook and Haddam.

The remaining 20 towns in the state, including Lyme, were in the Gray (lowest rate) Zone. This was the 23rd straight week for Lyme in the Gray Zone.

Aug. 19

This map, updated Aug. 19, 2021 shows the average daily rate of new cases of COVID-19 by town during the past two weeks. Lyme is still in the (lowest) Gray Zone, while Old Lyme has moved back into the Orange Zone.

The map above is from Aug. 19 when Old Lyme was back in the Orange (second highest case rate) Zone with a two-week case rate per 100,000 of 11.7. Other towns in the Orange Zone, which are within the Ledge Light Health District (LLHD), were East Lyme (10.4) and Stonington (12.7).

Almost 50 towns in the state remained in the Orange Zone, which was around the same number as the previous week including non-LLHD members Westbrook, Old Saybrook, Chester, and Salem locally.

Towns in the Red Zone in the LLHD were Groton – Town & City (15.6), New London (26.3), Ledyard (21.0), and North Stonington (17.9). Locally, Norwich and Waterford were also categorized as red, but they are not in the LLHD.

Less than 20 Connecticut towns were in the Yellow (second lowest) Zone down from 40 the previous week. Locally, these included including Deep River, Essex and East Haddam.

The remaining 20 towns in the state, including Lyme, are in the Gray (lowest rate) Zone. This was the 22nd straight week for Lyme in the Gray Zone.

Aug. 12

The map below is from Aug. 12 and shows that Old Lyme had fallen out of the Orange (second highest case rate) Zone into the Yellow (second lowest) Zone — but only by a fraction. Old Lyme’s two-week case rate per 100,000 was 9.8 — if it were 10.0, then it would have still been in the Orange Zone.

Towns in the Red Zone, which are within the Ledge Light Health District (LLHD), included New London, Ledyard, Stonington and North Stonington. Locally, Norwich and Waterford were also categorized as red, but they are not in the LLHD.

Other towns in the red category included Ansonia, Beacon Falls, Cheshire, East Haven, Easton, Hartford, Meriden, Middletown, New Britain, New Haven, North Branford, North Haven, Norwich, Plymouth, Stamford, Thomaston and Waterbury. At least three of these towns — Easton, Hartford and Thomaston — were in the Red Zone for the second consecutive week.

Almost 50 towns were in the Orange (second highest case rate) Zone — up from 33 the previous week — including Westbrook and Salem locally.

Old Lyme joined the Yellow (second lowest) Zone along with around 40 other Connecticut towns, including Old Saybrook, East Lyme, and Essex.

All remaining towns in the state, including Lyme, along with Deep River and Chester, were in the Gray (lowest rate) Zone. This was the 21st straight week for Lyme in the Gray Zone.

This map, updated Aug. 12, 2021 shows the average daily rate of new cases of COVID-19 by town during the past two weeks. Lyme is still in the (lowest) Gray Zone, but Old Lyme has moved into the Orange Zone.

Aug. 5

The map below is from Aug. 5 when six towns were in the Red (highest case rate) Zone (the previous week’s number was four) and 33 in the Orange (second highest case rate) Zone — the previous week’s number was four.

The towns in the Red Zone were East Hampton, Easton, Hampton, Hartford, Hartland, North Stonington*, and Thomaston.

There were 33 towns in the Orange Zone including Old Lyme, Waterford, New London, Groton, Ledyard and Stonington, all of which are in the Ledge Light Health District, as are the towns denoted with an * in the other zones.

East Lyme* had reentered the Yellow (second lowest) Zone along with more than 50 other Connecticut towns.

All remaining towns in the state, including Lyme*, were in the Gray (lowest rate) Zone. This was the 20th straight week for Lyme in the Gray Zone.

This map, updated Aug. 5, 2021 shows the average daily rate of new cases of COVID-19 by town during the past two weeks. Lyme is still in the (lowest) Gray Zone, but Old Lyme has moved into the Orange Zone.

July 29

The map below is from July 29, when four towns were in the Red Zone –Harland, Salem, Bozrah and Sprague — and four towns were in the Orange Zone — Easton, East Hampton, Ledyard and Thompson.

Old Lyme had reentered the Yellow (second lowest) Zone along with more than 50 other Connecticut towns. All remaining towns in the state, including Lyme, were in the Gray (lowest rate) Zone. This was the 19th straight week for Lyme in the Gray Zone.

This map, updated July 29, 2021 shows the average daily rate of new cases of COVID-19 by town during the past two weeks. Lyme is still in the (lowest) Gray Zone, but Old Lyme has moved into the Yellow Zone.

July 22

The map below is from July 22, when two towns, Franklin and Salem, were in the Red Zone (indicating the highest rate of COVID-19 new cases), which is up one from the previous week, and Andover remained in the (second highest rate) Orange Zone (down from two towns last week.)

Eight towns were in the Yellow Zone (indicating the lowest but one rate of COVID-19 new cases), which is up from two last week. They were Clinton, East Hampton, Manchester, Newington, Stonington, Westbrook, Windsor and Windsor Locks.

This map, updated July 22, 2021 shows the average daily rate of new cases of COVID-19 by town during the past two weeks. Both Lyme and Old Lyme are still in the (lowest) Gray Zone.

July 15

The map below is from July 15, when one town, Franklin, was in the Red Zone (indicating the highest rate of COVID-19 new cases) and another two, Salem and Andover, were in the (second highest rate) Orange Zone. New Hartford and Griswold were in the Yellow Zone (indicating the lowest but one rate of COVID-19 new cases.)

This map, updated July 15, 2021 shows the average daily rate of new cases of COVID-19 by town during the past two weeks. Both Lyme and Old Lyme are still in the (lowest) Gray Zone.

The map below is from July 8, when New Hartford was the sole town in the Yellow Zone.

This map, updated July 8, 2021 shows the average daily rate of new cases of COVID-19 by town during the past two weeks. Both Lyme and Old Lyme are still in the (lowest) Gray Zone.

The map below is from July 1, when Marlborough and Prospect were in the Yellow Zone.

This map, updated July 1, 2021 shows the average daily rate of new cases of COVID-19 by town during the past two weeks. Both Lyme and Old Lyme are still in the (lowest) Gray Zone.

The map below is from June 24, when Somers, Prospect and Bolton were in the Yellow Zone.

This map, updated June 24, shows the average daily rate of new cases of COVID-19 by town during the past two weeks. Both Lyme and Old Lyme are still in the (lowest) Gray Zone.

This is the June 17 map, when just one town, Bolton, was in the Yellow Zone.

This map, updated June 17, shows the average daily rate of new cases of COVID-19 by town during the past two weeks. Both Lyme and Old Lyme are still in the (lowest) Gray Zone.

For comparison, the map below is from June 3 and shows one town, Waterbury, in the Orange Zone and 21 towns in the Yellow Zone, down from 48 the previous week. The towns in the Yellow Zone were: Ansonia, Beacon Falls, Bloomfield, Brooklyn, Coventry, Cromwell, Derby, East Hartford, East Haven, Granby, Hamden, Hartford, Manchester, New Britain, New Haven, New London, Putnam, Rocky Hill, Shelton, Waterford and Windsor.

This map, updated June 3, shows the average daily rate of new cases of COVID-19 by town during the previous two weeks. Both Lyme and Old Lyme are in the (lowest) Gray Zone.

Below is the map from May 27 that showed one town in the Red Zone, Putnam, and 10 towns in the Orange Zone.

This map, updated May 27, shows the average daily rate of new cases of COVID-19 by town during the past two weeks. Both Lyme and Old Lyme were still in the (lowest) Gray Zone.

Compare the maps above with the one we published Dec. 18, 2020 to see the remarkable progress that has been made with controlling the spread of the virus through expansion of vaccination rates and improved mitigation strategies.

Map of Connecticut dated Dec. 17, 2020 showing both Lyme and Old Lyme now in the CT DPH-identified ‘Red Zone.’ This is defined as when the Average Daily Rate of COVID-19 Cases Among Persons Living in Community Settings per 100,000 Population By Town is over 15.

The following link provides centralized access to Connecticut COVID data: https://data.ct.gov/stories/s/COVID-19-data/wa3g-tfvc/