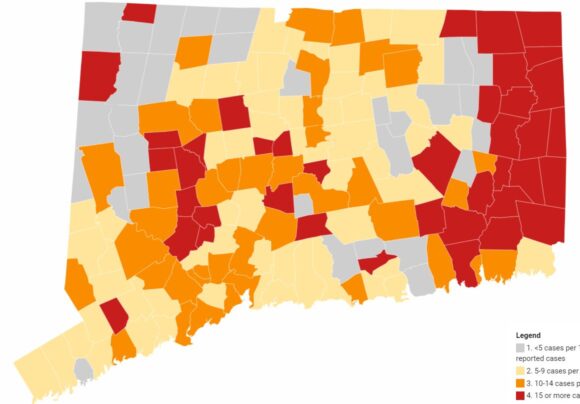
This map, updated Oct. 14, 2021 shows the average daily rate of new cases of COVID-19 by town during the past two weeks. Old Lyme and Lyme are both in the Gray (lowest) Zone. Only cases among persons living in community settings are included in this map; the map does not include cases among people who reside in nursing home, assisted living, or correctional facilities.) Map: Ver 12.1.2020 Source: CT Department of Public Health Get the data Created with Datawrapper. Details in italics are the same for each of the maps included in this article.
LYME/OLD LYME — Updated with Ledge Light information issued Oct. 15. The Daily Data Report for Connecticut issued Thursday, Oct. 14, by the Connecticut Department of Public Health (CT-DPH) for data as at 8:30 p.m. Wednesday, Oct. 13, has good news for both Lyme and Old Lyme. This report includes the weekly update, which is issued each Thursday.
The report shows that Old Lyme has moved down from the Orange (second highest) Zone for the average daily rate of new cases of COVID-19, in which it was placed last week, to the Gray (lowest) Zone, where Lyme has been since mid-September. The last time both towns were in the Gray Zone was July 22, 2021.
See detailed description of all four zones in italics below.
Connecticut’s daily positivity rate, however, has increased from 1.70 percent last week to 2.23 this week.
Reflecting that marginal increase in the positivity rate statewide, the latest average daily rate of new cases of COVID-19 by town during the past two weeks (see map above) similarly shows the number of towns in the Red Zone also marginally increasing from 37 last week to 40 this week.
Old Lyme reported no new, confirmed COVID-19 cases Thursday, Oct. 14, compared with Wednesday, Oct. 13, keeping Old Lyme’s cumulative total of confirmed cases at 431 for the ninth day in succession.
Lyme also reported no new cases on Thursday, Oct. 14, and therefore maintained its cumulative total of 130 for the third day in succession.
Both Lyme and Old Lyme reported Average Daily Case Rates of less than five this week,
On Aug. 26, the cumulative total of cases in Old Lyme was 372, meaning 59 cases have been confirmed since that date. Lyme’s cumulative total on Aug. 26 was 114 meaning 16 have also been confirmed there during the same period.
Lyme-Old Lyme Schools re-opened to students Aug. 26.
The Gray category is defined as when the Average Daily Rate of COVID-19 Cases Among Persons Living in Community Settings per 100,000 Population By Town is less than five or less than five reported cases.
The Yellow category is defined as when the Average Daily Rate of COVID-19 Cases Among Persons Living in Community Settings per 100,000 Population By Town is between five and nine reported cases.
The Orange category is defined as when the Average Daily Rate of COVID-19 Cases Among Persons Living in Community Settings per 100,000 Population By Town is between 10 and 14.
The Red category is defined as when the Average Daily Rate of COVID-19 Cases Among Persons Living in Community Settings per 100,000 Population By Town exceeds 15.
In all cases, this rate does not include cases or tests among residents of nursing home, assisted living, or correctional facilities.
Weekly Report from Ledge Light Health District (LLHD)
Editor’s Note: We have now received the LLHD report for this week.
Stephen Mansfield, LLHD Director of Health, prefaced the weekly LLHD report sent out Oct. 15, with these words, “We are happy to see a slight decrease in the number of new COVID cases.”
He added though, “It is imperative that we remain diligent in our mitigation strategies. We strongly advise everyone to wear masks indoors in public settings, regardless of vaccination status”
Mansfield also noted, “We have scheduled reoccurring COVID vaccination clinics at Ledge Light Health District every Wednesday.”.
The nine towns included in the LLHD show:
- three in the Red Zone: Ledyard, Waterford and North Stonington;
- three in the Orange (second highest) Zone: East Lyme, New London and Groton;
- three in the Yellow (second lowest) Zone: Stonington;
- two in the Gray Zone: Lyme and Old Lyme.
Vaccination Rates
Vaccination rates in Lyme and Old Lyme are encouraging with 86.5 percent of the population in Lyme having received at least one dose of the COVID-19 vaccine and the equivalent number for Old Lyme being 75.8 percent.
Percentages for the fully vaccinated are 82.0 for Lyme and 74.9 for Old Lyme.
These rates remain among the higher percentages in the state.
COVID-19 Cases Over Time: Dec. 2020-Aug. 2021
The following maps show has the picture of COVID-19 cases has gone from an almost totally red map back in Dec. 2020 to an almost all-gray map on June 17, 2021 and then back to a map with all colors represented in substantial number again.
Oct. 7
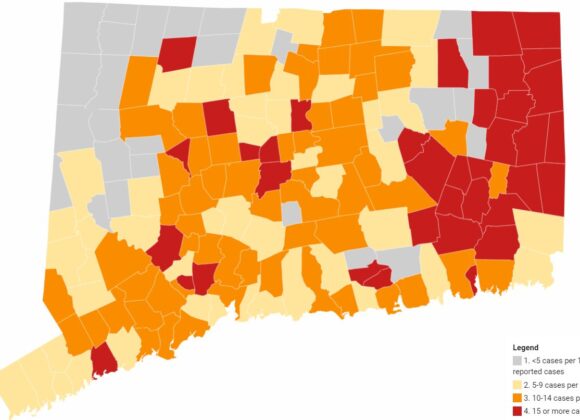
This map, updated Oct. 7, 2021 shows the average daily rate of new cases of COVID-19 by town during the past two weeks. Old Lyme has moved down to the Orange (second from highest) Zone while Lyme remains in the Gray (lowest) Zone.
The Daily Data Report for Connecticut issued Thursday, Oct. 7, by the Connecticut Department of Public Health (CT-DPH) has good news for Lyme but slightly improved news for Old Lyme.
The report showed that Old Lyme had moved down from the Red (highest) Zone for the average daily rate of new cases of COVID-19, in which it was placed the previous week, to the Orange (second from highest) Zone.
Lyme was still in the Gray (lowest) Zone and had had no new cases confirmed since Sept. 13.
Other signs were much more positive for our towns, with Lyme maintaining an Average Daily Case Rate of 0 (same as last week) while Old Lyme’s was 11.7 (down from 20.5 on Thursday last week.)
Connecticut’s daily positivity rate had increased from 1.26 percent last week to 1.70 this week.
Also, statewide, the latest average daily rate of new cases of COVID-19 by town during the past two weeks (see map above) had continued to slow with 37 towns now in the Red Zone, which was 20 less than last week’s total of 57. On Sept. 2, the total was 91 so the trend was clearly downward, and it has now surpassed the most recent record low of 39 reported on Aug. 12.
Old Lyme reported no new, confirmed COVID-19 cases Thursday, Oct. 7, compared with Wednesday, Oct. 6, keeping Old Lyme’s cumulative total of confirmed cases at 431 for the second day in succession.
Lyme also reported no new cases on Thursday, Oct. 7, and therefore maintained its cumulative total of 129 for the 21st day in succession. There was a blip on Oct. 4 and 5, when the state reported a new case in Lyme, but the state has now corrected that error.
On Aug. 26, the cumulative total of cases in Old Lyme was 372, meaning 59 cases have been confirmed since that date. Lyme’s cumulative total on Aug. 26 was 114 meaning 15 have also been confirmed there during the same period.
Lyme-Old Lyme Schools re-opened to students Aug. 26.
Sept. 30
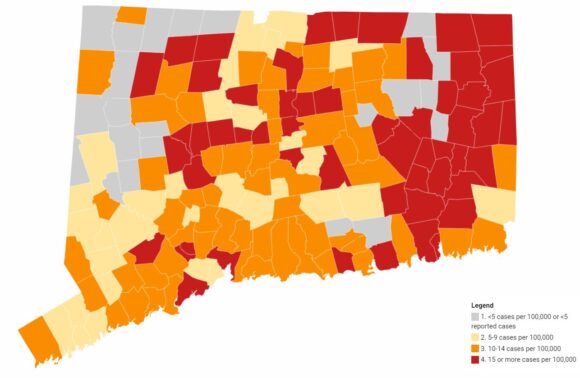
This map, updated Sept. 30, 2021 shows the average daily rate of new cases of COVID-19 by town during the past two weeks. Old Lyme remains in the Red (highest) Zone while Lyme has moved down to the Gray (lowest) Zone.
The Daily Data Report for Connecticut issued Thursday, Sept. 30, by the Connecticut Department of Public Health (CT-DPH) for data as at 8:30 p.m. Wednesday, Sept. 29, had good news for Lyme but continuing bad news for Old Lyme.
The report showed that Old Lyme remained in the Red (highest) Zone for the average daily rate of new cases of COVID-19. This was the fourth week in succession that Old Lyme had found itself in the Red Zone.
Lyme, meanwhile, had fallen from the Red (highest) Zone, in which it was placed last week, into the Gray (lowest) Zone.
Other signs were much more positive for our towns, however. Lyme now had an Average Daily Case Rate of 0 (down from 18.5 on Thursday last week) while Old Lyme’s was 20.5 (down from 22.5 on Thursday last week.)
Lyme had no new cases confirmed since Sept. 13; Old Lyme’s cumulative total has held steady since Sept. 27.
Statewide, there was also good news. Connecticut’s daily positivity rate stood at 1.26 percent down from 2.28 percent on Thursday last week.
Also, statewide, the latest average daily rate of new cases of COVID-19 by town during the past two weeks (see map above) continued to slow with 57 towns now in the Red Zone, which is 24 less than last week’s total of 81. On Sept. 2, the total was 91 so the trend is clearly downward, although it is still up from the 39 reported on Aug. 12.
Old Lyme reported no new, confirmed COVID-19 cases Thursday, Sept. 30, compared with Wednesday, Sept. 29. keeping Old Lyme’s cumulative total of confirmed cases at 426 for the fourth day in succession.
Lyme also reported no new cases on Thursday, Sept. 30, and therefore maintained its cumulative total of 129 for the 14th day in succession.
On Aug. 26, the cumulative total of cases in Old Lyme was 372, meaning 54 cases have been confirmed since that date. Lyme’s cumulative total on Aug. 26 was 114 meaning 15 have also been confirmed there during the same period.
Lyme-Old Lyme Schools re-opened to students Aug. 26.
Sept. 23
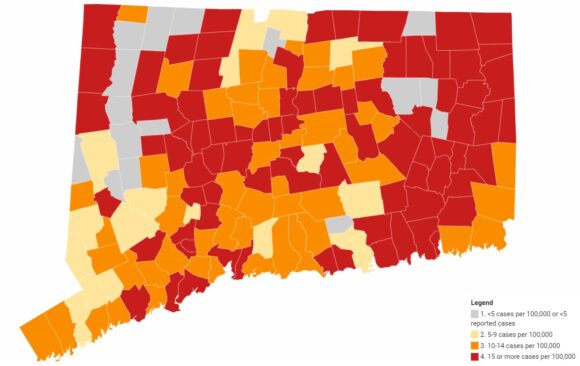
This map, updated Sept. 23, 2021 shows the average daily rate of new cases of COVID-19 by town during the past two weeks. Both Lyme and Old Lyme have moved into the Red (highest) Zone.
The Daily Data Report for Connecticut issued Thursday, Sept. 23, by the Connecticut Department of Public Health (CT-DPH) for data as at 8:30 p.m. Wednesday, Sept. 22, showed the following:
Both towns remained in the Red (highest) Zone for the average daily rate of new cases of COVID-19. This was the third week in succession that both towns had found themselves in the Red Zone.
Lyme had an Average Daily Case Rate of 18.5 (down from 43.2 on Thursday last week) while Old Lyme’s was 22.5 (down from 30.3 on Thursday last week.) A rate over 15.0 places a town in the Red Zone.
Connecticut’s daily positivity rate stood at 2.28 percent down from 2.93 percent on Thursday last week.
Statewide, the latest average daily rate of new cases of COVID-19 by town during the past two weeks (see map above) had continued to slow marginally with 81 towns now in the Red Zone, which is three down from the previous week’s total of 84. On Sept. 2, the total was 91 so the trend was undoubtedly downward although it was still up significantly from the 39 reported on Aug. 12.
Old Lyme reported no new, confirmed COVID-19 cases Thursday, Sept. 23, compared with Wednesday, Sept. 22. keeping Old Lyme’s cumulative total of confirmed cases at 419. This was the first day that there had not been a single new case reported in a 24-hour period in Old Lyme since Aug. 26.
Lyme also reported no new cases on Thursday, Sept. 23, and therefore maintained its cumulative total of 129 for the fourth day in succession.
On Aug. 26, the cumulative number of cases in Old Lyme was 372 meaning 47 cases had been reported since that date, while 12 had also been confirmed in Lyme during the same period.
Lyme-Old Lyme Schools re-opened to students Aug. 26.
Sept. 16
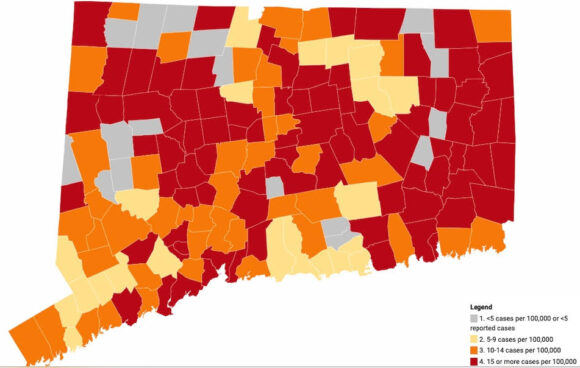
This map, updated Sept. 16, 2021 shows the average daily rate of new cases of COVID-19 by town during the past two weeks. Both Lyme and Old Lyme have moved into the Red (highest) Zone.
The Daily Data Report for Connecticut issued Thursday, Sept. 16, by the Connecticut Department of Public Health (CT-DPH) showed the following:
Both towns remained in the Red (highest) Zone for the average daily rate of new cases of COVID-19. This is the second week in succession that both towns found themselves in the Red Zone. See detailed description of the zones in italics below.
Lyme had an Average Daily Case Rate of 43.2 while Old Lyme’s was 30.3. A rate over 15 places a town in the Red Zone.
Connecticut’s daily positivity rate stood at 2.93 percent, down from 3.36 on Thursday last week.
Despite this poor situation locally, statewide, the latest average daily rate of new cases of COVID-19 by town during the past two weeks (see map above) remained relatively constant over the past week with 84 towns now in the Red Zone, which was only one higher than last week’s total of 83.
Old Lyme reported four new, confirmed COVID-19 cases Thursday, Sept.16, since the previous CT DPH report issued Wednesday, Sept. 15. This means Old Lyme’s cumulative total of confirmed cases rose to 411, while Lyme reported no new cases and therefore kept its cumulative total at 129.
On Aug. 26, the cumulative number of cases in Old Lyme was 372 meaning 39 cases have been reported since that date, while 12 have also been confirmed in Lyme during the same period.
Lyme-Old Lyme Schools re-opened to students Aug. 26.
Sept. 9
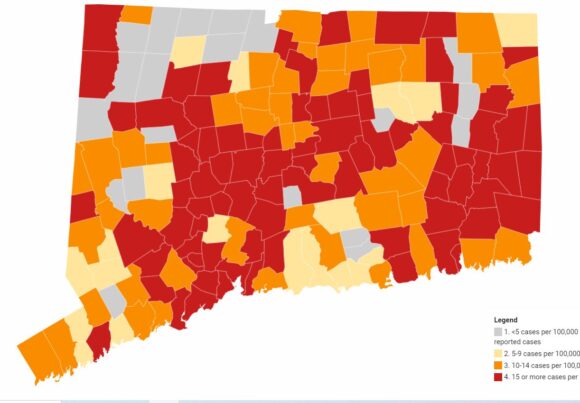
This map, updated Sept. 9, 2021 shows the average daily rate of new cases of COVID-19 by town during the past two weeks. Both Lyme and Old Lyme have moved into the Red (highest) Zone.
The Daily Data Report issued Thursday, Sept. 9, by the Connecticut Department of Health (CT DPH) showed the following:
These 47 towns were in the Orange (second highest) Zone: Avon, Bethlehem, Bloomfield, Branford, Bridgeport, Brookfield, Burlington, Colchester, Danbury, Durham, East Haddam, East Lyme, East Windsor, Easton, Ellington, Fairfield, Farmington, Greenwich, Groton, Hamden, Killingly, Killingworth, Lebanon, New Milford, Newington, North Canaan, Old Saybrook, Pomfret, Portland, Salem, Shelton, Sherman, Simsbury, Somers, South Windsor, Southbury, Stamford, Stonington, Suffield, Tolland, Washington, West Hartford, Wethersfield, Willington, Wilton, Windsor Locks and Woodstock.
These 19 towns were in the Yellow (second lowest) Zone: Bethany, Bethel, Canton, Clinton, Coventry, Darien, Essex, Guilford, Haddam, Madison, Mansfield, New Canaan, Redding, Ridgefield, Thompson, Westbrook, Westport, Winchester and Woodbury.
These 20 towns were in the Gray (lowest) Zone: Andover, Barkhamsted, Bridgewater, Canaan, Chester, Colebrook, Cornwall, Deep River, Eastford, Goshen, Granby, Hampton, Hartland, Kent, Middlefield, Morris, Norfolk, Roxbury, Scotland and Weston.
All other towns in the state, including Lyme and Old Lyme, were in the Red (highest) Zone.
Sept. 2
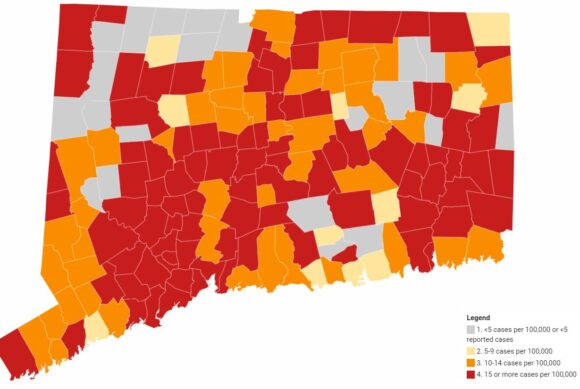
This map, updated Sept. 2, 2021 shows the average daily rate of new cases of COVID-19 by town during the past two weeks. Lyme is still in the (lowest) Gray Zone, while Old Lyme has moved back down into the Yellow Zone.
The map above is from Sept. 2 when 91 towns were in the Red Zone, which is down one from 92 a week ago on Aug. 26, but still up significantly from 73 on Aug. 19, and 39 on Aug. 12.
Connecticut’s seven-day positivity rate stood at 3.36 percent, down from 3.52 last week.
Old Lyme had fallen to the Yellow (second lowest) Zone along with 10 other towns. This total of 11 towns is unchanged from last week, when Old Lyme was in the Orange Zone.
Lyme was in the Gray (lowest) Zone. This was the 24th straight week for Lyme in the Gray Zone. Again, this total of 20 towns in the Gray Zone was unchanged from last week.
Forty-seven towns were in the Orange (second highest) Zone.
Aug. 26
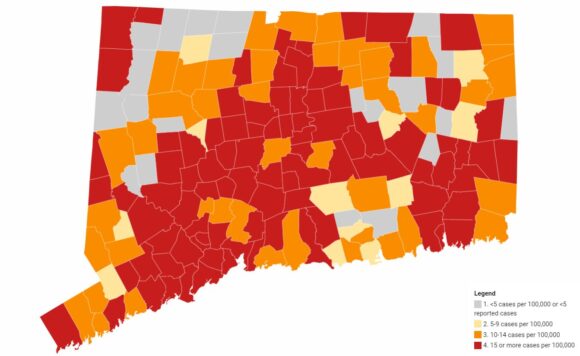
This map, updated Aug. 26, 2021 shows the average daily rate of new cases of COVID-19 by town during the past two weeks. Lyme is still in the (lowest) Gray Zone, while Old Lyme has moved back down into the Yellow Zone.
The map above is from Aug. 26, when Old Lyme was in the Orange (second highest case rate) Zone with a daily case rate per 100,000 of 10.8. Other towns in the Orange Zone, which are within the Ledge Light Health District (LLHD), were East Lyme (12.4), North Stonington (13.7) and Stonington (14.2).
Towns in the Red Zone in the LLHD were Groton – Town & City (15.6), New London (31.1), and Ledyard (25.9). Locally, Norwich, Montville and Waterford were also categorized as red, but they are not in the LLHD.
Eleven Connecticut towns were in the Yellow (second lowest) Zone down from 20the previous week. Locally, these included Deep River, Old Saybrook and Haddam.
The remaining 20 towns in the state, including Lyme, were in the Gray (lowest rate) Zone. This was the 23rd straight week for Lyme in the Gray Zone.
Aug. 19
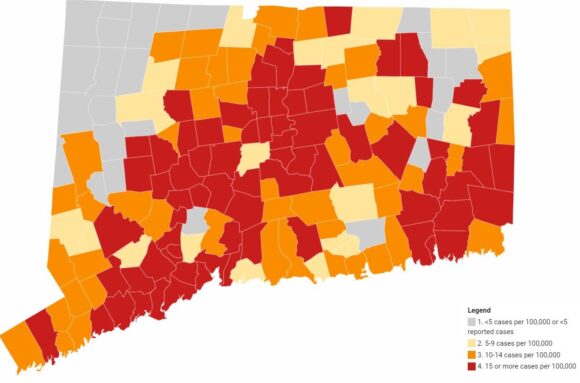
This map, updated Aug. 19, 2021 shows the average daily rate of new cases of COVID-19 by town during the past two weeks. Lyme is still in the (lowest) Gray Zone, while Old Lyme has moved back into the Orange Zone.
The map above is from Aug. 19 when Old Lyme was back in the Orange (second highest case rate) Zone with a two-week case rate per 100,000 of 11.7. Other towns in the Orange Zone, which are within the Ledge Light Health District (LLHD), were East Lyme (10.4) and Stonington (12.7).
Almost 50 towns in the state remained in the Orange Zone, which was around the same number as the previous week including non-LLHD members Westbrook, Old Saybrook, Chester, and Salem locally.
Towns in the Red Zone in the LLHD were Groton – Town & City (15.6), New London (26.3), Ledyard (21.0), and North Stonington (17.9). Locally, Norwich and Waterford were also categorized as red, but they are not in the LLHD.
Less than 20 Connecticut towns were in the Yellow (second lowest) Zone down from 40 the previous week. Locally, these included including Deep River, Essex and East Haddam.
The remaining 20 towns in the state, including Lyme, are in the Gray (lowest rate) Zone. This was the 22nd straight week for Lyme in the Gray Zone.
Aug. 12
The map below is from Aug. 12 and shows that Old Lyme had fallen out of the Orange (second highest case rate) Zone into the Yellow (second lowest) Zone — but only by a fraction. Old Lyme’s two-week case rate per 100,000 was 9.8 — if it were 10.0, then it would have still been in the Orange Zone.
Towns in the Red Zone, which are within the Ledge Light Health District (LLHD), included New London, Ledyard, Stonington and North Stonington. Locally, Norwich and Waterford were also categorized as red, but they are not in the LLHD.
Other towns in the red category included Ansonia, Beacon Falls, Cheshire, East Haven, Easton, Hartford, Meriden, Middletown, New Britain, New Haven, North Branford, North Haven, Norwich, Plymouth, Stamford, Thomaston and Waterbury. At least three of these towns — Easton, Hartford and Thomaston — were in the Red Zone for the second consecutive week.
Almost 50 towns were in the Orange (second highest case rate) Zone — up from 33 the previous week — including Westbrook and Salem locally.
Old Lyme joined the Yellow (second lowest) Zone along with around 40 other Connecticut towns, including Old Saybrook, East Lyme, and Essex.
All remaining towns in the state, including Lyme, along with Deep River and Chester, were in the Gray (lowest rate) Zone. This was the 21st straight week for Lyme in the Gray Zone.
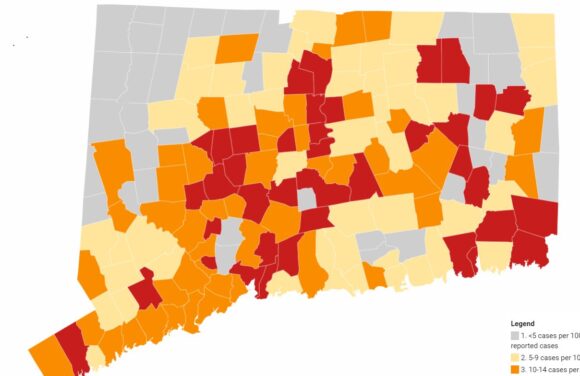
This map, updated Aug. 12, 2021 shows the average daily rate of new cases of COVID-19 by town during the past two weeks. Lyme is still in the (lowest) Gray Zone, but Old Lyme has moved into the Orange Zone.
Aug. 5
The map below is from Aug. 5 when six towns were in the Red (highest case rate) Zone (the previous week’s number was four) and 33 in the Orange (second highest case rate) Zone — the previous week’s number was four.
The towns in the Red Zone were East Hampton, Easton, Hampton, Hartford, Hartland, North Stonington*, and Thomaston.
There were 33 towns in the Orange Zone including Old Lyme, Waterford, New London, Groton, Ledyard and Stonington, all of which are in the Ledge Light Health District, as are the towns denoted with an * in the other zones.
East Lyme* had reentered the Yellow (second lowest) Zone along with more than 50 other Connecticut towns.
All remaining towns in the state, including Lyme*, were in the Gray (lowest rate) Zone. This was the 20th straight week for Lyme in the Gray Zone.
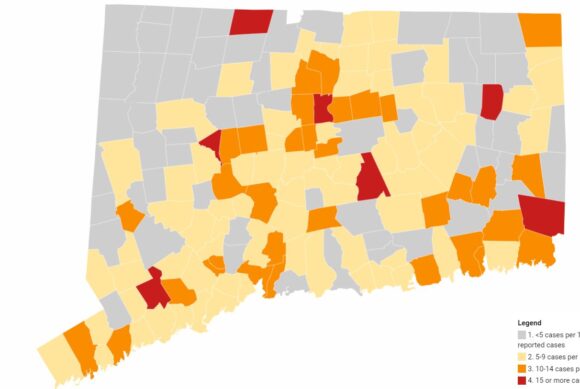
This map, updated Aug. 5, 2021 shows the average daily rate of new cases of COVID-19 by town during the past two weeks. Lyme is still in the (lowest) Gray Zone, but Old Lyme has moved into the Orange Zone.
July 29
The map below is from July 29, when four towns were in the Red Zone –Harland, Salem, Bozrah and Sprague — and four towns were in the Orange Zone — Easton, East Hampton, Ledyard and Thompson.
Old Lyme had reentered the Yellow (second lowest) Zone along with more than 50 other Connecticut towns. All remaining towns in the state, including Lyme, were in the Gray (lowest rate) Zone. This was the 19th straight week for Lyme in the Gray Zone.
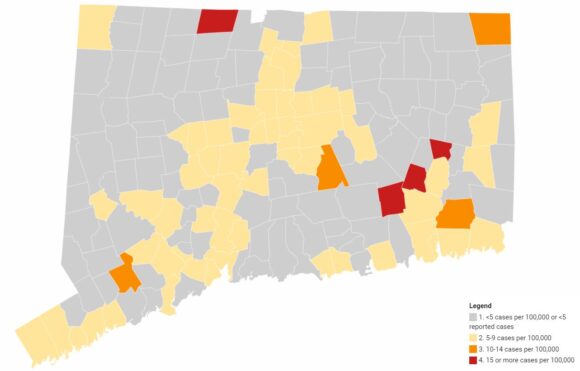
This map, updated July 29, 2021 shows the average daily rate of new cases of COVID-19 by town during the past two weeks. Lyme is still in the (lowest) Gray Zone, but Old Lyme has moved into the Yellow Zone.
July 22
The map below is from July 22, when two towns, Franklin and Salem, were in the Red Zone (indicating the highest rate of COVID-19 new cases), which is up one from the previous week, and Andover remained in the (second highest rate) Orange Zone (down from two towns last week.)
Eight towns were in the Yellow Zone (indicating the lowest but one rate of COVID-19 new cases), which is up from two last week. They were Clinton, East Hampton, Manchester, Newington, Stonington, Westbrook, Windsor and Windsor Locks.

This map, updated July 22, 2021 shows the average daily rate of new cases of COVID-19 by town during the past two weeks. Both Lyme and Old Lyme are still in the (lowest) Gray Zone.
July 15
The map below is from July 15, when one town, Franklin, was in the Red Zone (indicating the highest rate of COVID-19 new cases) and another two, Salem and Andover, were in the (second highest rate) Orange Zone. New Hartford and Griswold were in the Yellow Zone (indicating the lowest but one rate of COVID-19 new cases.)

This map, updated July 15, 2021 shows the average daily rate of new cases of COVID-19 by town during the past two weeks. Both Lyme and Old Lyme are still in the (lowest) Gray Zone.
The map below is from July 8, when New Hartford was the sole town in the Yellow Zone.

This map, updated July 8, 2021 shows the average daily rate of new cases of COVID-19 by town during the past two weeks. Both Lyme and Old Lyme are still in the (lowest) Gray Zone.
The map below is from July 1, when Marlborough and Prospect were in the Yellow Zone.

This map, updated July 1, 2021 shows the average daily rate of new cases of COVID-19 by town during the past two weeks. Both Lyme and Old Lyme are still in the (lowest) Gray Zone.
The map below is from June 24, when Somers, Prospect and Bolton were in the Yellow Zone.

This map, updated June 24, shows the average daily rate of new cases of COVID-19 by town during the past two weeks. Both Lyme and Old Lyme are still in the (lowest) Gray Zone.
This is the June 17 map, when just one town, Bolton, was in the Yellow Zone.

This map, updated June 17, shows the average daily rate of new cases of COVID-19 by town during the past two weeks. Both Lyme and Old Lyme are still in the (lowest) Gray Zone.
For comparison, the map below is from June 3 and shows one town, Waterbury, in the Orange Zone and 21 towns in the Yellow Zone, down from 48 the previous week. The towns in the Yellow Zone were: Ansonia, Beacon Falls, Bloomfield, Brooklyn, Coventry, Cromwell, Derby, East Hartford, East Haven, Granby, Hamden, Hartford, Manchester, New Britain, New Haven, New London, Putnam, Rocky Hill, Shelton, Waterford and Windsor.

This map, updated June 3, shows the average daily rate of new cases of COVID-19 by town during the previous two weeks. Both Lyme and Old Lyme are in the (lowest) Gray Zone.
Below is the map from May 27 that showed one town in the Red Zone, Putnam, and 10 towns in the Orange Zone.

This map, updated May 27, shows the average daily rate of new cases of COVID-19 by town during the past two weeks. Both Lyme and Old Lyme were still in the (lowest) Gray Zone.
Compare the maps above with the one we published Dec. 18, 2020 to see the remarkable progress that has been made with controlling the spread of the virus through expansion of vaccination rates and improved mitigation strategies.
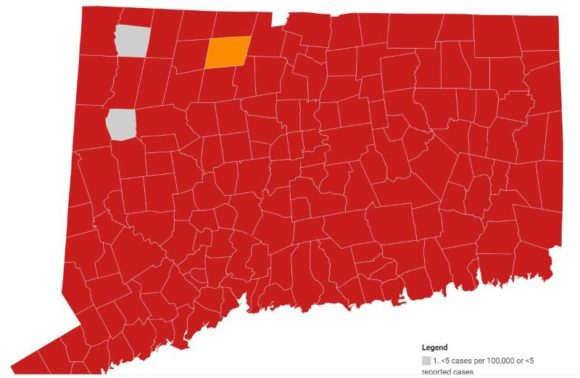
Map of Connecticut dated Dec. 17, 2020 showing both Lyme and Old Lyme now in the CT DPH-identified ‘Red Zone.’ This is defined as when the Average Daily Rate of COVID-19 Cases Among Persons Living in Community Settings per 100,000 Population By Town is over 15.
The following link provides centralized access to Connecticut COVID data: https://data.ct.gov/stories/s/COVID-19-data/wa3g-tfvc/

 LYME/OLD LYME — The Daily Data Report issued Friday, Oct. 15, at 4 p.m. by the Connecticut Department of Health (CT DPH) shows one new confirmed COVID-19 cases in Old Lyme compared with Thursday’s number, taking the town’s cumulative total of cases to 432.